User Tools

Site Tools


en:ecovirt:roteiro:metap_duas:metap_coexrcmdr

Coexistence in Metapopulations - Tutorial for EcoVirtual

In which conditions can species coexist? There are several hypotheses about this, but in this exercise we will investigate the effect of the perturbation regime that an area endures, with differences in the colonization capabilities for the species, as we are still studying the colonization and extinction processes, as described by the metapopulation models.

We will start with the internal colonization model, in which a species dynamics is already familiar to you:

$$\frac{df_1}{dt}=i_1f_1(1-f_1)- p_e f_1 $$

Here:

  • $f$ = fraction of occupied patches
  • $p_e$ = local extinction probability
  • $i$ = increase in the colonization probability as $f$ grows
  • The rate of colonization is, then, the product $if$, that varies with the patch occupancy.

Now, we will add another species to the system. The second species will be a weak competitor: it will only persist in patches in which the first species is absent. This means that the patches available for colonization are only the empty patches, and that it is excluded from whichever patch is colonized by the first species. The variation of fraction of patches occupied by the second species is given by:

$$\frac{df_2}{dt}=i_2f_2(1-f_1-f_2)- i_1f_1f_2 - p_e f_2 $$

Things you should know about this model

Interpretation

The equation for species 2 does not add any new coefficient, but only combinations of things we have already seen:

  • The term $i_2f_2(1-f_1-f_2)$ indicates that the fraction of patches that can be colonized is proportional to the number of patches that are empty, from both species.
  • The term $i_1f_1f_2$ is the expected fraction of patches occupied by species 2 that will be colonized by species 1. Thus, it represents the fraction of the patches in which species 2 will be excluded by species 1.

* The extinction rate from both species is the same, so we didn't add a subscript.

Equilibrium

The fraction of patches that are occupied by species 1 in equilibrium remains the same:

$$F_1=1-p_e/i_1$$

And now the fraction of patches occupied by species 2 in equilibrium is:

$$F_2=p_e/i_1- i_1/i_2$$

So, in order to have a viable metapopulation of species 2 ($F_2>0$), it is necessary that the following inequality is satisfied:

$$p_e/i_1 > i_1/i_2$$

Optional: Where did this come from?

Here you can read a tutorial explaining the mathematical deduction of the fraction of patches occupied by species 2 in equilibrium, that you can run in MAXIMA.

The deduction only needs simple algebraic manipulations. If you are scared of maths, keep in mind that you only need to understand the logic behind each step. To do the algebraic manipulation *per se*, there are lots of symbolic mathematics programs that can help you, such as MAXIMA, which is open source and free to use)).

Download and install the program and the graphical interface wxMaxima, open the script linked above and press crtl-R to run.

Simulation

To proceed, you must have the R environment with the Rcmdr and Ecovirtual packages installed and loaded. If you do not have and do not know how to have them, see the Installation page.

Let us run a computer simulation to generate a stochastic dynamic following the same rules as the differential model described above. The simulation is very similar to other simulation you have already seen on EcoVirtual :

Pseudocode

  1. Define a matrix with $r$ rows and $c$ columns. Each cell in the matrix is a habitat patch.
  2. Define the fraction of initially occupied patches (fi1 and (fi2), and occupy random patches until you reach the determined fraction.
  3. Calculate the colonization probability from each species (using the product pi = i*f).
  4. From the occupied patches, draw a number of patches to go extinct, following the extinction probability pe.
  5. From the unoccupied patches, draws some to be occupied by species 1, according to the above probability.
  6. From the unoccupied patches, draws some to be occupied by species 2, according to the above probability. If the selected patch is already occupied from species 1, the colonization fails and nothing happens.
  7. Counts the number of occupied patches from each species to determine the fractions of occupancy,
  8. Repeat from step 3 until the desired number of iterations is reached.

The arguments to this function are the number of rows and columns for the habitat matrix, the number of time intervals that should be run, initial fraction of patches occupied by each species, and the model parameters i1, i2 and pe.

Metapopulation competition in EcoVirtual

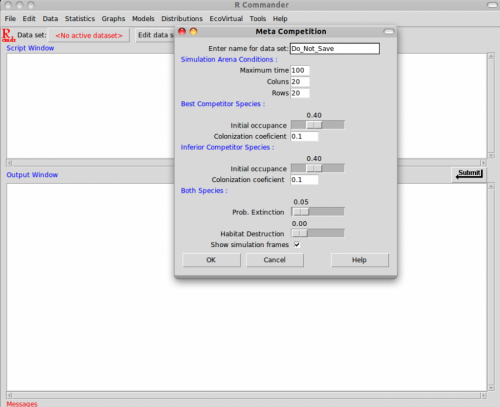
To run the simulation tutorial, just open the Meta Competition window, under the menu EcoVirtual>Two species> Meta Competition… . The following window will open:

metacomcoex.png

The parameters here are almost the same as the internal colonization model, but adding a second species:

option parameter effect
data set R object stores the simulation results
Maximum time $$tmax $$ number of model iterations to be run
columns $$cl$$ number of columns in the habitat
rows $$rw$$ number of rows in the habitat
Best Competitor Parameters for the best competitor
initial occupancy $$f01 $$ pproportion of initial patch occupancy by species 1
colonization coef. $$i1$$ c colonization coefficient for sp1
Inferior Competitor Parameters for the inferior competitor
initial occupancy $$f02 $$ proportion of initial patch occupancy by species 2
colonization coef. $$i2$$ colonization coefficient for sp2
Both Species Parameters shared by both species
prob. extinction $$pe$$ extinction probability
Habitat Destruction $$D$$ proportion of patches not available
Show simulation frames anima=TRUE should every step be graphically animated?

What is the secret of coexistence?

Qual o segredo de Tostines?

Start a simulation with the following parameters:

tmax = 100
cl = 20 
rw = 20,
f01 = 0.1
f02 = 0.4
i1 = 0.4
i2 = 0.5  
pe = 0.25

Calculate the equilibrium value for each species using the formulas shown above. Verify that the theoretical values are close to the simulations results.

Competition vs. Colonization balance

Don't be destructive!

The parameter D in the model controls how much habitat is removed at the start of each simulation. Don't use your immense destructive powers by now, as this will be done on the next tutorial. For now, always leave this parameter as zero.

We have defined the species 2 as the worse competitor. Does this sentence it to extinction? Examine the effect of the difference between the colonization capabilities over coexistence. To do this, we will vary the colonization parameter for species 2, keeping everything else constant. Identify the conditions for coexistence, and for extinction of each species.

Start simulating the following parameters:

tmax = 100 
cl = 20
rw = 20 
f01 = 0.05 
f02 = 0.05
i1 = 0.1 
i2 = 0.1 
pe = 0.05

Now keep everything unchanged, except for i2. Change i2 to:

  1. from 0.2 to 1 with step 0.1
  2. 10
  3. 100

What is the interpretation of these results?

  • The condition for persistence of species 2 is given by an inequality involving the ratio i1/i2, which expresses the difference in colonization capability between the species. See the formulas in the section Equilibrium

Extinction regime

Let's start a new simulation with a new combination of parameters, in which species 2 has triple the colonization capability as species 1:

tmax = 100, 
cl = 20,
rw = 20, 
f01 = 0.1,
f02 = 0.1,
i1 = 0.1,
i2 = 0.3,
pe = 0.05 

Does this simulation lead to extinction? Vary the extinction probability keeping the other parameters constant, to investigate the effect of the perturbation regime over the results.

  1. Increase pe to 0.07
  2. Vary the pe from 0.08 to 0.14, with step 0.02

If the equilibrium is not being reached:

Tips

Many times, in order to check the predictions of a stochastic models, we need to run the simulation for longer times. When the graphical animation is toggled, it can take a while to process. In order to shorten the required time, turn off the animation by deselecting “Show simulation frames”. (anima=FALSE).

Initial proportion of occupied patches

Patch occupancy can be defined as the proportion of available patches that are being occupied by a species. In our model, the initial occupancy for each species is given by fi1 and fi2.

  1. Run some simulation to check if these parameters affect the long term behavior of the populations
  2. Are the trajectories different for different initial occupancies? Does it change the coexistence?

Questions

  1. Which attributes of the inferior competitor enable the coexistence with the superior competitor? What is the biological interpretation for this?
  2. What is the relationship between coexistence and local extinction in this model? Think about the theoretical and applied consequences.
  3. What is the effect that species 2 has over species 1 in this model? What is the most straightforward simulation to show this clearly?
  4. What is the equilibrium occupancy for species 2 when species 1 is absent from the whole landscape?

To learn more

  • Hastings, A. (1980) Disturbance, coexistence, history and competition for space. Theoretical Population Biology, 18:363–373.
  • Stevens, M.H.H. (2009) A primer in ecology with R. New York, Springer.
en/ecovirt/roteiro/metap_duas/metap_coexrcmdr.txt · Last modified: 2017/10/17 11:42 by melina.leite