User Tools

Site Tools


en:ecovirt:roteiro:comuni:comuni_classr

Classification Analysis - R Tutorial

class2.jpeg The classification methods group objects according to similarity between them. If we take samples of the communities in which we recorded the presence or abundance of each species, it may be useful to check whether the samples form discrete sets. Therefore, we must first calculate an index that tells us how much each sample is similar to others in terms of species composition. The first part of this tutorial explains how to calculate measures of similarity and distance between sampled parcels. Then we use a method of classification analysis over the parcels to finally present data graphically in a dendrogram.

Similarity and Distance

similaridade.jpg There is a plethora of indexes used in ecology to measure the similarity or dissimilarity (distance) between objects. The first step for sorting communities is to use these indexes to express the difference between pairs of samples of communities. In ecology, these samples generally can have two types of information: i) which species are present (data presence / absence, also called binary), or ii) the abundance 1) of each species present (quantitative data).

Similarity by presence and absence

Jaccard

The Jaccard index indicates the proportion of species shared between two samples on the total species. One way to calculate it is: $$J= \frac{S_{com}}{s_1 + s_2 - S_{com}}$$

Equivalently: $$J= \frac{S_{com}}{S}$$

where:

  • $S_{com}$ is the number of species that are present in both sites
  • $ s_1$ and $s_2$ are the total number of species in each sample
  • $S$ is the total number of species in both samples

Let's assume that we took a sample from two vegetation parcels. The number of individuals of plant species found in each of these fictitious parcels was:

plot_1 plot_2
sp_1 2 8
sp_2 13 6
sp_3 0 5
sp_4 1 15
sp_5 20 0

Comparing the presence / absence of species, do you think the plots are very similar or very different? And comparing the abundance of species? We will use these values to calculate the Jaccard index in R. For this, copy the following commands and paste them into the R command line (obs.: phrases that begin with the “#” are only comments):

 
## Two fictitious parcels
(plot1=c(2,13,0,1,20))
(plot2=c(8,6,5,15,0))
## creating the "parcel" object with all the data
(parcels=data.frame(plot1,plot2))
## Number of species in each parcel
(nsp_1=sum(plot1>0))
(nsp_2=sum(plot2>0))
## Number of shared species
(nsp_com=sum(plot1>0 & plot2>0))
## Jaccard index
jacc= nsp_com/(nsp_1 + nsp_2 - nsp_com)
jacc

How similar are these two parcels? Remember this value!

Similarity by abundance

abundanciaarv.jpeg

When we compare samples not only by the presence, but also by their abundances we need to use a quantitative index. One way to think of these indexes is the measure of distance, ie by how much a parcel is different from each other, measured by the difference between the abundances of species. In the following sections, we'll see two of the quantitative indexes commonly used in community ecology.

Euclidean Distance

The reverse or adjunct of a similarity index is a measure of distance. In the previous example we could say that we have similarity of 60% among parcels or dissimilarity (or distance) between them of 100% - 60% = 40%!

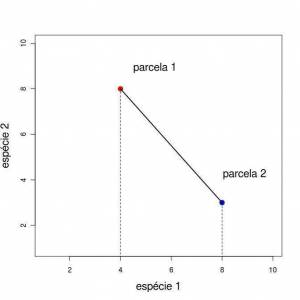
One of the most common distance measurements is the Euclidean distance based on measures in a Cartesian coordinate system. We can use it to express the distance between two samples of vegetation where we recorded the abundance of each species. If we recorded only two species, their abundances can be represented on a Cartesian plane, in which the X axis have the abundance of one species and the Y axis the abundance of the other. The points on the graph represent two samples / parcels (Obs.: these are not our fictional plots created above). euclDist.jpeg In this case, the Euclidean distance can be seen as a distance between two parcels, measured in units of individuals of both species. To calculate the distance, we simply use Pythagoras theorem, such as:

$$d_E=\sqrt{(x_1-x_2)^2 + (y_1-y_2)^2}$$

Here, $x_1$, $x_2$ are the abundances of one species in parcels $1$ e $2$, and $y_1$, $y_2$ are the abundances of the other species in the same parcels.

If we increase the number of species, it gets harder to visualize this graphically, but the logic remains the same and the equation becomes:

$$d_E\ = \ \sqrt{\sum_{i=1}^S(n_{i1}-n_{i2})^2}$$

Here, $n_{i1}$ and $n_{i2}$ are the abundances of the $i$-th species in the first and second parcels, and $S$ is the total number of species.

Let's calculate the Euclidean distance between our two fictitious parcels?

eucl=sqrt(sum((plot1-plot2)^2))
eucl

In our case, the distance between these parcels is of 26.6 individuals. What does that mean? Is this distance small or large? It's hard to answer that with only one measure, right?

Although the Euclidean distance is very easy to understand and very useful for classification analysis, it does not vary in a range from 0 to 1, so the value obtained is not comparable to values obtained by other measures of similarity ranging from 0 and 1. So, in order to compare the similarity measure obtained for presence / absence (by Jaccard index) with a similarity measure obtained for abundance data we use another measure which we call “Bray-Curtis”, in honor of its authors.

Bray-Curtis

The Bray-Curtis index can be expressed as a ratio of similarity or dissimilarity (distance) in species abundance. In any case its values ranging from a maximum of one to a minimum of zero. This standardization in the range between one and zero facilitates the interpretation and comparison.

Similarity

Bray-Curtis similarity index is given by: $$\frac{2\sum_{i=1}^S \min(n_{i1},n_{i2})}{N}$$

Here, $N$ is the sum of individuals in all species/parcels, and $\min(n_{i1},n_{i2})$ is the minimum of the abundances of species $i$ between both parcels. As we have already seen, $n_{i1}$ and $n_{i2}$ are the abundances of the $i$-th species in the first and second parcel, and $S$ is the total number of species.

Distance

Bray Curtis dissimilarity index (or distance) is given by: $$\frac{\sum_{i=1}^S|n_{i1}-n_{i2}|}{N}$$

Here, $|n_{i1}-n_{i2}|$ is the absolute value of the difference between the abundances of species $i$ in each parcel.

Calculations

Let's calculate the Bray-Curtis similarity index between our fictitious parcels!

bc.sim=2*sum(apply(parcels, 1, min))/(sum (parcels))
bc.sim

What value have you observed? Is this similar to Jaccard's index? What is the interpretation for this?

Similarity Matrix

To proceed in this tutorial, we will need to use the samples taken from virtual communities in the gradient patterns tutorial. Make sure the R objects are still in your workspace using the ls() command to list the current objects. You should see the samp.cont and samp.disc objects, such as:

> ls()
[1] "dev"  "mea"  "samp.cont"  "samp.disc"  

Now let's apply the Bray-Curtis index to the set of parcels sampled along a simulated environmental gradient. To do so, we need to write a function that calculates the similarity between each pair of parcels. There it is:

sim<-function(data, index="bc")
{
  nplot=dim(data)[2]
    similar=matrix(1,ncol=nplot,nrow=nplot)
    rownames(similar)<-paste("plot", c(1:nplot))
    colnames(similar)<-paste("plot", c(1:nplot))
    for(i in 1:(nplot-1))
    {
      m=i+1
        for(m in m:nplot)
        {
          if(index=="jacc")
          {
            data[data>0]=1
              co.oc=sum(data[,i]>0 & data[,m]>0)
              total.sp=sum(data[,i])+sum(data[,m])-co.oc
              similar[i,m]=co.oc/total.sp 
              similar[m,i]=co.oc/total.sp
          }
          if(index=="bc") 
          {
            bc.sim=2*sum(apply(data[,c(i,m)], 1, min))/(sum (data[,c(i,m)]))
              similar[i,m]=bc.sim
              similar[m,i]=bc.sim
          }
        }
    }
  return(round(similar,3))
}

Apply this function to our continuous virtual community:

sim.cont1=sim(samp.cont, index="bc")
sim.cont1

What is the value in row 1, column 4?

sim.cont1[1,4]

How about the line 4, column 1?

sim.cont1[4,1]

Verify if the same thing happens for line 5, column 7 versus line 7, column 5.

  1. What do the **1.00* mean in the resulting matrix?
  2. Why are the values in line1, col4 equal to line4, col1?
  3. Can you identify patterns in the data?

Do the same for the discrete community samples (stored in samp.disc), but store the resulting matrix in an object called sim.disc1.

Grouping

clusterbaloon.jpeg There are several possible methods and algorithms2) to group the objects in a classification analysis. First we need to decide if we want to start grouping together the similar elements (agglomerative analysis) or if we want to take the entire set of objects and proceed by separating into groups (divisive analysis). In our case, let's start with the parcels as units and begin creating successively, building on those already formed. This is called hierarchical agglomeration cluster analysis. Despite the ugly name, there is nothing complicated in logic behind the analysis. We will follow it step by step.

What is the maximum of similarity in this matrix?

max(sim.cont1, na.rm=TRUE)

Let's ask R which values correspond to this maximum:

sim.cont1==max(sim.cont1, na.rm=TRUE)

In the now-produced matrix, the “TRUE” values indicates the positions in which the maximum values are observed. Note that all “TRUE” are in the main diagonal of the matrix produced. These similarities are of no interest to us, because in our matrix these values correspond to the similarity of a parcel with itself. There's no use grouping something with itself.

Furthermore, all similarity values are repeated above and below the diagonal3) Therefore, we need to remove the diagonal of our similarity matrix, as well as redundancy (the upper triangle of the matrix).

name.par=rownames(sim.cont1)
upper.tri(sim.cont1, diag=TRUE)
sim.cont1[upper.tri(sim.cont1, diag=TRUE)] <- NA
sim.cont1

The “upper.tri” function selects all the values that are above the main diagonal in the matrix. In short, what we are doing here is creating a new matrix (but we will keep the same name “sim.cont1”) in which the values of the main diagonal and values the triangle above the main diagonal are disregarded4)).

firstcall.jpeg Now that we have removed the diagonal, let's look for the largest similarity value:

max1=max(sim.cont1,na.rm=TRUE)
max1

Then, we ask R which pair of parcels presents this similarity value:

largest1=which(sim.cont1==max(sim.cont1,na.rm=TRUE), arr.ind=TRUE)
largest1

Let's take only the first value. To make sure we are only selecting one pair, do this:

pair1=name.pair[largest1[1,]]
pair1
cat("\n\t 1st link:", paste(pair1[1],pair1[2], sep=" x "), "; link = ", max1, "\n" )

This is our first group!

Now we have to make another decision: how will this group we have just formed connect with other parcels? There are different “Connection methods”. We can decide that it will connect to other parcels by the value of maximum similarity of its components (maximum binding), the minimum, the average, the centroid of the group, etc. In our case, we will use the connection method for the group average (abbreviated as UPGMA).

In UPGMA, in order to set the next parcel to be linked, we use the arithmetic mean of the similarity between the parcel you want to include in a group and every existing parcel that group. The parcel is then assigned to the group with which it has largest average similarity (Valentin 2012).

To do this, create a new distance matrix same as before, with one difference: the two grouped parcels are now replaced by the group. This new matrix then has the similarities between all parcels that have not been grouped, and among all and the first created group. As we are using the UPGMA method, the similarity between the group and the remaining parcels is the average of the similarities of the parcels inside the group with other parcels.

The code below makes it step by step. Do not worry too much about the commands of each step, but try to understand the end result, which is displayed after the last command:

## Preamble: a label for the group in the matrix
g1.n1=strsplit(name.pair[largest1[1,2]]," ")[[1]][2]
g1.n2=strsplit(name.pair[largest1[1,1]]," ")[[1]][2]
g1.name=paste("g", paste(g1.n1,g1.n2, sep=","))
g1.name # this just holds the label of the group
## New matrix
mat.g1=sim.cont1[-largest1[1,],-largest1[1,]]
g1a=apply(sim.cont1[largest1[1,],-largest1[1,]],2,mean)
g1a[is.na(g1a)]=0
g1b=apply(sim.cont1[-largest1[1,],largest1[1,]],1,mean)
g1b[is.na(g1b)]=0
gr1=rbind(mat.g1,g1a+g1b)
group1=cbind(gr1,NA)
rownames(group1)<-c(name.pair[-largest1[1,]],g1.name)
colnames(group1)[dim(group1)[2]]<-g1.name
group1 

We now repeat the same steps. First, we look for the most similar pair of elements. Note that this can be:

  • Two parcels not included in the first group. In this case, a new group is created.
  • One parcel, and the first group. In this case, the parcel is added to the existing group.

Execute the code below to find out what happens!

name.pair2=rownames(group1)
max2=max(group1,na.rm=TRUE)
max2
largest2=which(group1==max(group1,na.rm=TRUE), arr.ind=TRUE)
largest2
g2.n1=strsplit(rownames(group1)[largest2[1,2]]," ")[[1]][2]
g2.n2=strsplit(rownames(group1)[largest2[1,1]]," ")[[1]][2]
g2.name=paste(paste("g",g2.n1,sep="_"),g2.n2, sep=",")  
g2.name
cat("\n\n\t 2nd link ", paste(name.pair2[largest2[1,2]],name.pair2[largest2[1,1]], sep=" x "), "; link = ", max2, "\n" )

Next, we create a new similarity matrix:

  • If a new group was created, repeat what we did in the first link: the two parcels comprising it will be

removed from the similarity matrix, and substituted by the group. The similarities are calculated between each parcel and the new group. For this, we calculate the similarity of each parcel group to each parcel that is not the group. Then we calculate the average of these similarities, which then is used as similarity of the group to parcels.

  • If a parcel is added to the existing group, the similarity of the group to each parcel is recalculated. This

is done by calculating the average of the similarity of the group parcels (which are now three) to each parcel. Then calculate the average of these similarities, which then is used as similarity of the group to parcels.

The code below does this, and the last line shows the resulting matrix:

mat.g2=group1[-largest2[1,],-largest2[1,]]
g2a=apply(group1[largest2[1,],-largest2[1,]],2,mean)
g2a[is.na(g2a)]=0
g2b=apply(group1[-largest2[1,],largest2[1,]],1,mean)
g2b[is.na(g2b)]=0
gr2=rbind(mat.g2,g2a+g2b)
group2=cbind(gr2,NA)
rownames(group2)<-c(name.pair2[-largest2[1,]],g2.name)
colnames(group2)[dim(group2)[2]]<-g2.name
group2

Compare this new similarity matrix with the one we have obtained in the first link, by typing:

group1

Again, we search for the next largest link in the new matrix:

name.pair3=rownames(group2)
max3=max(group2,na.rm=TRUE)
max3
largest3=which(group2==max(group2,na.rm=TRUE), arr.ind=TRUE)
largest3
g3.n1=strsplit(rownames(group2)[largest3[1,2]]," ")[[1]][2]
g3.n2=strsplit(rownames(group2)[largest3[1,1]]," ")[[1]][2]
g3.name=paste(paste("g",g3.n1,sep="_"),g3.n2, sep=",")  
g3.name
cat("\n\n\t 3rd link ", paste(name.pair3[largest3[1,2]],name.pair3[largest3[1,1]], sep=" x "), "; link = ", max3, "\n" )

And we create a new group…

mat.g3=group2[-largest3[1,],-largest3[1,]]
g3a=apply(group2[largest3[1,],-largest3[1,]],2,mean)
g3a[is.na(g3a)]=0
g3b=apply(group2[-largest3[1,],largest3[1,]],1,mean)
g3b[is.na(g3b)]=0
gr3=rbind(mat.g3,g3a+g3b)
group3=cbind(gr3,NA)
rownames(group3)<-c(name.pair3[-largest3[1,]],g3.name)
colnames(group3)[dim(group3)[2]]<-g3.name
group3

If we continue to do the same, we will end up having only one group, in which the last link connects the last of the groups. It may be didactic, but it's certainly tedious!

But we're lucky, and there's an R function that does this for us. Now that we have understood the logic, we can simply use it! If you still have any doubts about the hierarchical classification, redo the steps above or call for help! If you understood the steps, you now can start a conversation in your favorite bar or club with “Do you know about the hierarchical agglomerative algorithm?” It will certainly be cool to see the face of your interlocutor…

Now we will run the entire classification analysis using the hclust function. The argument method allows for other link methods, look for the references in the to learn more section to learn about other link functions. Let's use the “average” method here:

clas.cont1=hclust(as.dist(1-sim.cont1), method="average")

A good way of visualizing the grouping analysis is by plotting a dendrogram. Create one by typing:

  dend.cont1=as.dendrogram(clas.cont1, hang=-1)
  plot(dend.cont1)

A dendrogram is a graphical representation of a hierarchical classification like the one we did. That is, it graphically represents a sequence of elements linked to other elements. The result is a hierarchy because they are groups within groups within groups …

To interpret a dendrogram, take one of the parcels, which are the terminal branches on a dendrogram. Follow it until you find the first link. This is the first element that is connected to the parcel. This “first neighbor” could be another parcel or group of parcels. On the scale next to the dendrogram see the value at the point of connection. This is the distance (dissimilarity) between the two elements. You can do this with any dendrogram elements.

Now you can create and compare the dendrograms obtained with cluster analysis with four different connection methods:

par(mfrow=c(2,2))
clas.cont1a=hclust(as.dist(1-sim.cont1), method="single")
plot(as.dendrogram(clas.cont1a, hang=-1), ylab="Bray-Curtis", main="Single link")
clas.cont1b=hclust(as.dist(1-sim.cont1), method="complete")
plot(as.dendrogram(clas.cont1b, hang=-1), ylab="Bray-Curtis", main="Complete link") 
clas.cont1c=hclust(as.dist(1-sim.cont1), method="average")
plot(as.dendrogram(clas.cont1c, hang=-1), ylab="Bray-Curtis", main="Average link")
clas.cont1d=hclust(as.dist(1-sim.cont1), method="centroid")
plot(as.dendrogram(clas.cont1d, hang=-1), ylab="Bray-Curtis", main="Centroid link", ylim=c(0,0.7))

Let's understand the code above:

  1. To do several graphs in the same window, we have set the parameter mfrow to 2 columns, 2 rows.
  2. To use different clustering methods, we have altered the method function of the hclus function.

Now let's do the dendrogram for the discrete communities sample, using the average connection method (UPGMA):

  • 1. Calculate the Bray-Curtis distance matrix:
sim.disc=sim(samp.disc, index="bc")
  • 2. Run the clustering analysis:
clas.disc=hclust(as.dist(1-sim.disc), method="average")
  • 3. Plot the dendrogram:
plot(as.dendrogram(clas.disc, hang=-1), ylab="Bray-Curtis",main="UPGMA")

Finally, you can also create the dendrograms for other connection methods using the data from the discrete communities:

par(mfrow=c(2,2))
clas.disc1a=hclust(as.dist(1-sim.disc), method="single")
plot(as.dendrogram(clas.disc1a, hang=-1), ylab="Bray-Curtis", main="Single link")
clas.disc1b=hclust(as.dist(1-sim.disc), method="complete")
plot(as.dendrogram(clas.disc1b, hang=-1), ylab="Bray-Curtis", main="Complete link") 
clas.disc1c=hclust(as.dist(1-sim.disc), method="average")
plot(as.dendrogram(clas.disc1c, hang=-1), ylab="Bray-Curtis", main="Average link")
clas.disc1d=hclust(as.dist(1-sim.disc), method="centroid")
plot(as.dendrogram(clas.disc1d, hang=-1), ylab="Bray-Curtis", main="Centroid link", ylim=c(0,0.7))

Now it's your turn...

abundasarney.jpeg

  1. Explain the differences between the results for the clustering analyses with different connection methods.
  2. Compare the dendrograms for the continuous and discrete communities using the same connection method, and interpret the differences on how each community responds to the environmental gradient.
  • To answer the first question, you will need to understand the connection algorithms. Take a look at the summary from the multivariate analysis course by Alan Fielding.

To learn more

excellent course by Alan Fielding.

  • Manly, B. 2008. Métodos Estatísticos Multivariados: Uma Introdução. 3 Ed. Artmed, Porto Alegre. (One of the best introduction to multivariate analyses for biologists).
  • Valentin, J. 2012. Ecologia Numérica: Uma Introdução à Análise Multivariada de Dados Ecológicos. Interciência, Rio de Janeiro. (Another good introductory text)
  • Legendre, P., & Legendre, L. 2012. Numerical ecology. Elsevier, Amsterdan. (The complete reference for numerical ecology. Very didactic, although it's a more advanced reference).
1)
which can be measured in several ways
3)
the value in the cell [1,4] is the same cell [4,1], remember?
4)
we do this by placing values NA in such positions of the array. NA is the R code to missing data ( Not available
en/ecovirt/roteiro/comuni/comuni_classr.txt · Last modified: 2017/10/24 10:08 by melina.leite