This translation is older than the original page and might be outdated. See what has changed.

User Tools

Site Tools


en:ecovirt:roteiro:pop_str:pstr_mtr

Population matrix models - Tutorial in R

Leslie/Lefkovitch Matrices

matrix.gif

The growth of a population with an age structure can the projected using matrix algebra. Leslie matrices have the information about birth and death rates of different age classes of a population and are a robust way of figuring out the population growth and make projections for different scenarios. A generalization of the Leslie matrix occurs when the population is classified due to development stages instead of age classes (Lefkovitch matrices). In this scenario, an individual may reproduce, die, grow from one stage to another, or stay in the same stage. In this generalization, the basic vital rates are built into the transition matrix elements, which are used to figure out the effect that individuals from having a number of individuals in each class on the number of individuals in each class at the next time step.

Objective

The objective of this exercise is understand how can we study structured populations with these matrix models. Let's start with some matrix multiplication rules and eigenvalues/eigenvectors!

Entering the matrix

figurapill.jpg

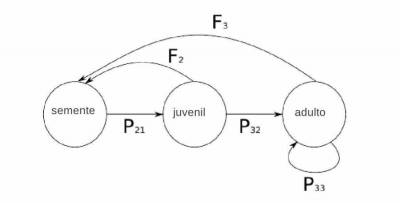
Let's imagine that we have collected some data on a palm tree population. We have found out that the population is divided in the following stages: seed (F1), juvenile (F2) and adult (F3). Now imagine that 50% of the juveniles survive to become adults, 90% of the adults survive at each year, and for each 100 seeds, we have encountered 30 juveniles. Moreover, we can estimate the production of seeds by each juvenile in 0.5 and for each adult in 20. In other words:

matrizestruturada.jpeg

From this data, we can build a Leslie matrix for this population:

matrizestruturada2.jpeg

In a census for the initial number of individuals, we have found 100 seeds, 250 juveniles and 50 adults. That is our initial condition vector $N(t)$.

Let's run some projections for this population. In R, when we want to make matrix operations, we have to use a specific notation. For matrix multiplication, for example, we need to use the notation %*%. And that's it! The program runs the multiplication with all the mathematical rules.

# Leslie matrix
A <- matrix(c(0, 0.5, 20, 0.3, 0, 0, 0, 0.5, 0.9), nr = 3, byrow = TRUE)
A
# initial population vector N  
N0 <- matrix(c(100, 250, 50), ncol = 1)

To project the population for the next time step (in our case, next year), we need to calculate: $ N(t+1) = An(t) $

N1 <- A %*% N0
N1

Now we can project the population for a larger time interval and see what happens.

years <- 10
N.projected <- matrix(0, nrow = nrow(A), ncol = years+1)
N.projected[, 1] <- N0

for (i in 1:years)
{
	N.projected[, i + 1] <- A %*% N.projected[,i]
}

par(mfrow=c(1,2))
matplot(0:years, t(N.projected), type = "l", lty = 1:3, ylab = "n(t)", xlab = "Time (t)", xlim=)
legend("topleft", legend = c("Seed", "Juvenile", "Adult"),lty = 1:3, col = 1:3, bty = "n")
matplot(0:years, log(t(N.projected)), type = "l", lty = 1:3, ylab = "n(t)", xlab = "Time (t)", xlim=)
legend("topleft", legend = c("Seed", "Juvenile", "Adult"),lty = 1:3, col = 1:3, bty = "n")
par(mfrow=c(1,1))

Exercise 1: Interpreting the graphs

  • Is the projection observed on the graph (a) expected for a structured projection model?
  • How can you interpret the graph generated in (b)?

A little help

Here goes a function that project populations from the transition matrix and initial state (tmax is the maximum time). That's basically what we did above, but now wrapped up as a function.

proj.mat

########################
## Matrix projection
########################
proj.mat<-function(n0, matproj, tmax)
{
	res.mat<-matrix(NA,nrow=tmax+1,ncol=length(n0))
		res.mat[1,]<-n0
		for(i in 2:(tmax+1))
		{
			res.mat[i,]=matproj %*% res.mat[(i-1),]
		}
	return(res.mat)
}
######################
## running the function ##
######################
nEst<-proj.mat(n0=N0, matproj=A , tmax=10)
matplot(1:11, nEst, type="l")
#########################
# population size ##
########################
nPop<-apply(nEst,1, sum)
plot(1:11, nPop)

Growth rate

$ \lambda = \frac{N_{t}}{N_{t-1}}$

Let's see how the growth rate behaves!

#############################
# Population growth ##
#############################
lambPop<-nPop[2:11]/nPop[1:10]
matplot(1:10, lambPop, type="b", pch=1)

Exercise

  • project the matrix for longer times.
  • see how the population growth rate $\lambda$ behaves
  • run the same simulation after changing some parameter of the transition matrix
  • how does the growth rate change over time? Does this pattern change if you change any parameter of the model?

Stage distribution

A very important characteristic of this model is observing the relative stage distribution of the population. Does the proportion of each stage vary over a trajectory of the simulation? Let's see it for ourselves!

##########################
# stage proportion ##
##########################
propEst<-nEst/nPop
matplot(1:11, propEst, type="l")

Exercise

  • 1. What is the contribution, as a proportion of individuals, of each stage to the total size of the population?
  • 2. Does this distribution change over time?
  • 3. Run some simulations to illustrate your last answer.
  • 4. Figure out the population growth rate at each time step and make a graph of this rate over time.

Exercise (again?!!)

  • Again, increase the simulation time to see what happens
  • Change some parameters of the transition matrix and initial population to see what patterns change and what stays the same.

Perturbation analyses

We can infer the contribution of each matrix element to the total population growth rate by doing perturbation analyses on the matrix. The logic behind them is simple: if we change only one of the transition values, keeping everything else constant, the change in $\lambda$ that we will see is a reflex of the change in the element we are looking at. This way, we can assess the contribution of each transition element, and consequently of the vital rates for each life stage, to the growth of the population as a whole. In our example matrix, the transition (or more accurately permanence) in the adult stage corresponds to the survival rate in this stage. We can then ask the following question:

  • If some external factor changed the adult survival rate, what would be the consequence for the population as a whole?

Let's answer that question?

###########################################
## Disturbing the adult survival rate ##
###########################################
pert=seq(0,1, by=.05)
resAd=rep(NA, length(pert)) 
names(resAd)<-paste("p", pert, sep="_")
for(i in 1:length(resAd))
{
	Ai<-A
		Ai[3,3]<-pert[i]
		projAi= proj.mat(n0=N0,matproj=Ai, tmax=100)
		nAi=apply(projAi, 1, sum)
		lambi=nAi[101]/nAi[100]
		resAd[i]<-lambi
}
resAd

Exercise

* 1. Does the adult survival rate has a strong influence in the population's future? * 2. Thinking about sustainable extraction from this population, how could you use this analysis to base recommendations about the population management? * 3. Is the population extinction immediate if the survival rate of the population changed to zero? * 4. Do the same type of analyses, but now for the transition of the seeds to juveniles, and compare this to the adult survival rate. Which transition is more important to the future of the population? * 5. The proportion of the individuals in each stage to the total population size changes after the matrix is disturbed?

To learn more

Gotelli, N. J. 2007. Ecologia. Cap.3- Crescimento Populacional Estruturado. Pp. 49-82. Ed. Planta.

Gurevitch, J, Scheiner, S.M, Fox, G.A. 2009. Ecologia Vegetal. Cap. 5 - Ed. Artmed, São Paulo.

Freckleton, R.P., Silva Matos, D.M., Bovi, M.L.A & Watkinson, A.R. 2003. Predicting the impacts of harvesting using structured population models: the importance of density-dependence and timing of harvest for a tropical palm tree. Journal of Applied Ecology, 40: 846-858.

Silva Matos, D.M., Freckleton, R.P. & Watkinson, A.R. 1999. The role of density dependence in the population dynamics of a tropical palm. Ecology, 80: 2635-2650.

en/ecovirt/roteiro/pop_str/pstr_mtr.txt · Last modified: 2017/10/03 08:49 by melina.leite