User Tools

Site Tools


en:ecovirt:roteiro:den_ind:di_edrcmdr

Density-independent population dynamics with demographic stochasticity - Tutorial for Ecovirtual

dodos.jpg

The deterministic models of population dynamics do not consider the variability in individual fitness. For example, when we use the discrete growth model

$$N_{t+1} = 1,5 \times N_t$$

we suppose that, for each time interval, the average balance between births and deaths is around 3 over 2, causing an increase of 50% in the population size. This can happen if half of the individuals die without generating offspring and the other half survive and give birth to 2 young each. It is also possible that all of the original population dies, but one individual have $1.5 \times N_t$ offspring before dying.

The reasoning is the same for all of the other deterministic models. In the exponential growth model $$N(t) = N_0e^{rt}$$

the population growths by a rate of $e^{rt}$, due to the instantaneous growth rate $r$, which is no more and no less than the balance of the birth and death rates.

In short, the population rates are averages that result from a large number of arrangements between births and deaths in a population, most of them with fitness variations. The simple fact that the rates are not integers should hint that there is variation, as a birth rate of 0.5 / yr indicates that some individuals reproduce and others don't, as babies don't come in halves!

The demographic stochasticity is the effect of the individual fitness variability over the population dynamics. The objective of this tutorial is to understand the logic behind the construction of population dynamics models that incorporate these effects, and learn some of their properties.

Only deaths

Let's start with a population of $N_0$ individuals in which there are no births and no migration. Individuals die at a per capita instantaneous rate of $\mu = 0,693 \ \text{yr}^{-1}$. The simplest model to figure out the population size over time is the exponential model:

$$N(t)=N_0e^{(\text{births}-\text{deaths})t} \ = \ N_0 e^{-0,693t}$$

With this mortality rate, this model predicts that the population is halved for each year1).

For this to happen, half of the individuals die and half remains alive. Does that mean that our mortality rate is not the same for everyone? To keep the homogeneity premise (and to keep our model simple) we can say that the probability of dying is the same for everyone. In our case, every individual has a 50% chance of surviving for one more year. If we start out with $N_0=100$, after one year we should have on average 50 individuals, then 25 and so on, as the exponential model predicts.

But there is an important difference now: in our new model, chance plays a role in varying the population size around the average:

Let's suppose we have just 2 individuals. Each of them has a 50% of chance of survival for each year. Assuming that the probabilities are independent, there are three possible results2): * Both individuals die, with probability $0.5 \times 0.5 = 0.25$ * One individual die and the other survives, with probability $2 \times 0.5 \times 0.5 = 0,5$3) * Both individuals die, with probability $0.5 \times 0.5 = 0.25$

This shows that our stochastic4) there is more than one possible result for the future population. Now we have uncertainty in the projection, which can be very large. In our example with 2 individuals, the chance that we find the expected result is just 50%!

But don't panic!. Our example also shows that this uncertainty can be measurable. It's possible to figure out the probabilities for each possible model outcome. In our models in which individuals just die, the probability that an individual will survive to time $t$ is:

Survival Probability $$p(t)=e^{-\mu t}$$

So, we expect to see $p(t)N_0$ individuals on $t$. In other words, the expected population size5) is the same as the model with no stochasticity:

$$E[N(t)]\ = \ p(t)N_0 \ = \ N_0e^{-\mu t}$$

This shows that, on the average, the model with stochasticity results in the same projections as the deterministic one. But how much variation is there around this average? In other words, what is the probability that each other value should occur?

Distribution of probabilities for the population sizes

How to calculate the chance of each population size occurring? This brings us to the concept of probability distributions. Let's start with a simple calculation: the probability that all individuals survive until the time $t$ in our stochastic model with only deaths. We call this probability $P(N(t) \!=\! N_0)$. As we assume that the odds of death are independent between individuals, its value is:

$$P(N(t)\!=\!N_0) \ = \ p(t)^{N_0}$$

For small population sizes, this probability may be high, as our example with $N_0=2$ and $p(t\!=\!1)=0,5$ shows:

$$P(N(t)=2)\ = \ 0,5^2 \ = \ 0,25$$

But when the population is large, the chances that all individuals will survive are very small. The same applies to the probability that all will die, which is

$$P(N(t)=0) \ = \ (1-p(t))^{N_0}$$

The reasoning is analogous to wonder what are the chances of having only heads or only tails in a number of coin tosses. All other values between these extremes are possible, and each of them corresponds to a probability given by:

$$P(N(t)\!=\!n) \ = \ \binom{N_0}{n} \ p(t)^n(1-p(t))^{(N_0-n)}$$

This is the binomial probability distribution. Given a certain initial number of individuals $N_0$ with equal and independent probabilities of dying after a time $t$, this distribution gives the probability of $n$ individuals surviving. In more general terms, the binomial gives the probability of success in $n$ success in $N_0$ attempts, given a constant probability of success for each attempt.

The binomial distribution

To proceed, you must have the R environment with the Rcmdr and Ecovirtual packages installed and loaded. If you do not have and do not know how to have them, see the Installation page.

Let us get acquainted with the idea of a probability distribution, by calculating values from the binomial distribution. On the R Commander menu, click DistributionsDiscrete distributionsBinomial distributionBinomial distribution graph. A window like this will open:

binomial_plot_dialog.png

With the options:

Option Effect
Binomial trials number of trials, in our case $N_0$
Probability of success probability of success at each trial, in our case the probability that an individual survives
Mass function graph / Cumulative function graph should the graph be made for each value or for the cumulative probability until this value?

Make the graph for our example: - Set the Binomial trials to $2$ - Set the Probability of success to $0.5$ - Select the Mass function graph option - Click Apply

You should see a new window with the graph of the number of successes (in our case, survivors), from zero to $N_0$, and their respective probabilities, according to the binomial distribution.

Arrange the windows so that the chart window and the options are side by side. Now you can evaluate the effect of changing the two parameters of the binomial: number of attempts and the probability of success. Try some values and propose general rules on its effects by clicking Apply at every attempt. The graph will be updated. Suggestions:

* Keep the number of attempts at 10 and make the probability of success go from $0$ to $1$ in steps of $0.2$. * Keep the probability of success at $0.5$ and increase the number of attempts as 2, 5, 10, 100, 1000.

Question

For a population under only deaths stochastic dynamic with a mortality rate $\mu = 0.693$ and initial size $ N_0= 10$: - What is the survival probability for $ t = 1 $, $ t = 2 $ and $ t = 3$? - Make the graphs of the probability distributions of the population sizes in these 3 times

Computer simulation

So far we have seen some theoretical properties of population dynamics with demographic stochasticity: - There are more than one possible population size at every time; - When there is only deaths the probability of population sizes for each time follow a binomial distribution; - The average population size for each time corresponds to the value predicted by the model without stochasticity (deterministic). We will now test in practice these properties, and find out some more, simulating populations with the stochastic dynamics of deaths.

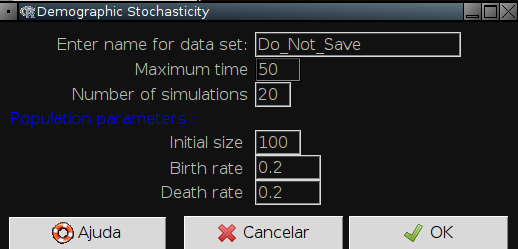
In the EcoVirtual menu, click EcovirtualOne PopulationDemographic Stochasticity. A window like this will open:

onepop_demo_stoc_dialog.png

We will simulate populations with demographic stochasticity in continuous time, with the following parameters:

Option parameter definition
Enter name for last simulation data set R object name of the R object in which to save the simulation results
Maximum time tmax maximum time for the simulation
Number of simulations nsim number of different populations to be simulated
Initial size N0 initial population size
birth rate b instantaneous birth rate
death rate d instantaneous death rate

Let's simulate ten populations for our first example, up to the time of 5. To do this, change the parameters accordingly:

tmax = 5
nsim = 10
N0 = 2
b = 0
d = 0;693

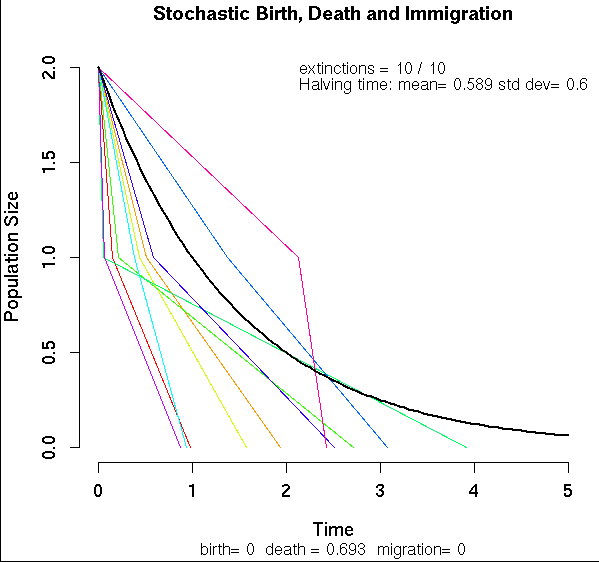
You should see a graph like this:

simpleD-plot.png

The colored lines are the trajectories of each of the ten populations, and the black line is the mean expected trajectory. On the top right corner there is the mean and standard deviation of the time that the populations take to diminish by one-half (which we call population halving time or half-life of the population).

Population half-life

The expected half-life in our simulation is about one year, but note how some populations took much more time as the others to fall from 2 to 1 individuals, and to become extinct. But let's see if the average time the populations took to reach half of the original size agrees with the theoretical value.

We can test this by simulating several populations with initial size $N_0=20$ and averaging the time they take to reach $N=10$. Set the simulation to:

  • Maximum time: 3
  • Number of simulations: 1000
  • Initial size : 20
  • birth rate : 0
  • death rate: 0.693

The graph will be covered with lots of lines, but we are interested in the value of Halving time. Is it near the theoretical value? Now change the population initial size to 80, keeping the other options unchanged and run the simulation again.

Questions

- What is the effect of the initial size on the mean and standard deviation of the population halving times? - How can you explain the results that you found?

Population size distribution

Let's inspect the distribution of the population sizes in the time $t=2$. To do this, we need to store the simulations in an R object. Run more simulations after setting the following options:

* Enter name for last simulation data set: sim1 * Maximum time: 2 * Number of simulations: 1000 * Initial size : 20 * birth rate : 0 * death rate: 0.693

And click OK. The results will be stored as a list of 1000 tables in R, called sim1. Each table contains the times in which the population lost an individual and the size of the population after that time, up to the maximum time set in the options window.

To see the first table, close the simulation window, copy the following command to the Script window of the Rcmdr and click Submit

sim1[[1]]

The table will be written on the window Output. Inspect the other tables: run the same command again, now changing the numeric index inside the double brackets to any other value between one and one thousand.

The population size at the end of the simulations ($t=2$) is variable. We know that the possible values run from zero to $N_0$ (in our case, 20). The expected probability distribution for these values is a binomial with $N_0$ trials and success probability of $p(t) = e^{- 0.693 \times 2} = 0.25$. You can make a graph of this distribution using the Distributions menu of the Rcmdr.

Now let's compare the theoretical distribution graph with our simulations results. Make a graph for the proportion of simulations that ended with each different size by running the following commands:

## gets the final population sizes
sim1.Nt <- sapply(sim1, function(x)x[nrow(x),2])
## transforms it into a contingency table
sim1.tab <- table(factor(sim1.Nt, levels=0:20))
## opens a new graphical window
x11()
## makes the graph with the realized proportions for each population size
plot(sim1.tab/1000, xlab="N(t=2)", ylab="Proportion of the populations", lwd=5)

Compare both graphs. Is there a good agreement? If you want to superpose both graphs, run:

## expected probabilities
(sim1.esp <- dbinom(0:20, size=20 ,prob=.25))
	lines(0:20,sim1.esp, col="blue", type="b")

Population average size

We already have saved a thousand simulated populations, so let's figure out the average size of the ending populations with:

mean(sim1.Nt)
Question

Is this average size near the expected value?

Births and deaths

What can we expect from a population in which both deaths and births are stochastic? The resulting model is an extension of the following, but now there is a probability that the population will grow. Let's use Ecovirtual to see what changes.

Computer simulations

Run a simulation of 200 populations with initial size 1 and birth rate equal to twice the death rate. Set the following options:

# save results in sim2 object
tmax = 20
nsim = 200
N0 = 1
b = 0.2
d = 0.1

The population sizes will now oscillate in a random walk, due to the succession of births and deaths. As the birth rate is twice the death rate, a population increase is twice as likely as a decrease. Common sense would tell us that this population is safe from extinctions. Is it so?

Mean population size

Just like our last model, the expected population size is

$$E[N(t)]=N_0e^{rt}$$

where $r$ is the instantaneous growth rate, that is, the difference between the birth and death rates. Once again, we have saved the simulation results in an R object, from which we can figure out the average population sizes. To do this, run the following commands:

sim2.Nt <- sapply(sim2, function(x)x[nrow(x),2])
mean(sim2.Nt)
Question

Does the observed mean population size agree with the theoretical?

Population size distribution

But we already know that the average of a variable does not tell us the whole story. As with any stochastic model, we don't have a single possible value for the population size at each time, but a set of possible values and their corresponding frequencies. Make a histogram of the final population sizes by running the following code:

sim2.tab <- table(factor(sim2.Nt, 
	levels=0:max(sim2.Nt)))/length(sim2.Nt)
plot(sim2.tab, xlab="N(tmax)", ylab="Proportion of the populations", lwd=5)

In the model with stochastic deaths, we have seen that the probabilities of finding each population size at each time followed a binomial distribution. In a model with deaths and births, the probabilities follow another distribution, called negative binomial.

What matters most here is the probability of population size zero, that is, the probability of extinction. In our simulations, the class $N(t)=0$ was the most frequent, which is easy to understand. As the initial population size is just one, there are one to two odds of the first event being a death, which immediately extinguishes the population.

Questions

- With a stochastic population model in which the birth rate is greater than the death rate, what is the effect of the following over the extinction probability? - Simulation time? - Initial population size? - Ratio between both rates? - Compare your conclusions with those obtained if the births and deaths are equivalent, as done in the random walk tutorial.

To learn more

  • Renshaw, E. (1991). Modelling biological populations in space and time Cambridge University Press. This tutorial is inspired on the second chapter of this book, which is a great introduction for stochastic models of births and deaths.
  • R tutorials about the discrete probability distributions, from the course on Statistical Modeling of the graduate program in ecology from the University of São Paulo. These include tutorials about the binomial and negative binomial distributions.
1)
in other words, the half-life of the population is one year. The half-life and doubling time are calculated in the same way.
2)
remember these basic rules of probability: 1 - the probability of independent events is the product of the probability of each event and 2 - the probability of mutually exclusive events is the sum of the probability of each event. See more here.
3)
we double the probabilities product because this result can happen in two different ways: individual A survives and B dies or individual A dies and B survives
4)
we use this word as a synonym for “probabilistic” here
5)
which is the same as the population projections average, $E[N(t)]$
en/ecovirt/roteiro/den_ind/di_edrcmdr.txt · Last modified: 2017/09/19 17:55 by melina.leite