User Tools

Site Tools


en:ecovirt:roteiro:comuni:comuni_virt1

Gradient patterns in communities - simulations in R

Let's build a virtual community of plants. To do this, we will build on the distribution of individuals in an environmental gradient. Assuming that the species have a normal distribution of abundances along the gradient, we can simulate something like empirical data.

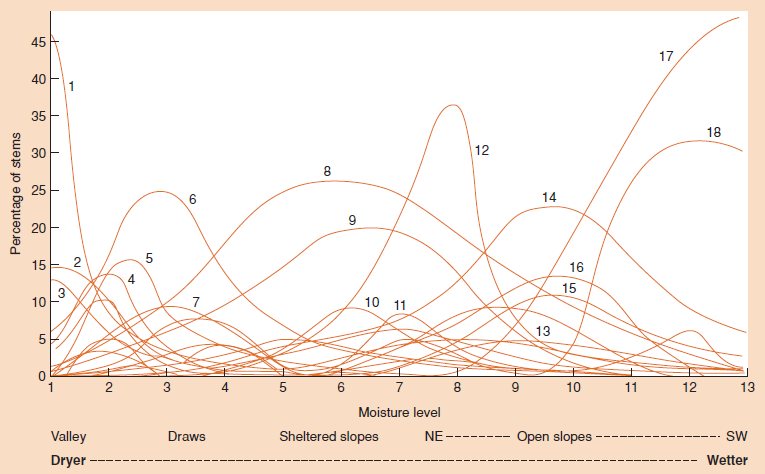
great_smoky.png * Figure 16.6 from Begon et al. (2006), showing the distribution of plant species in a humidity gradient in Great Smoky Mountains, Tennessee. Data taken from a classic paper by Robert Whittaker. Each curve represents the percentage of stems of a kind in relation to the total number of stems at a location. Note how the normal distribution can be a good approximation of species abundances along a gradient.

The normal distribution, or Gaussian distribution, has two parameters that correspond to the mean and standard deviation. From these parameters we can construct curves representing the theoretical proportion of individuals of each species along the gradient.

Drawing a gradient graph

In R, it's easy to create a community of species along a gradient. Copy and paste the following function in an R session:

graf.com=function(medias, desvios, minimo, maximo, leg=TRUE)
{
	dnorm.trunc=function(x, minimo=-Inf, maximo=Inf, media=0, desvio=1)
	{
	res=numeric(length(x))
	x.prov=dnorm(x,mean=media, sd=desvio)
	ampl.norm=pnorm(maximo,mean=media, sd=desvio)-pnorm(minimo,mean=media, sd=desvio)
	x.prov/ampl.norm
	}
  nsp=length(medias)
  cor=rainbow(nsp)
  n.min=which.min(desvios)
  curve(dnorm.trunc(x, medias[n.min], desvios[n.min], maximo=maximo, minimo=minimo),from=minimo, to=maximo, ylab="densidade da população", xlab="valor do gradiente", main="Distribuição no gradiente", col=cor[n.min])
seqsp=1:nsp
seqsp=seqsp[-n.min]
	for (i in seqsp)
 	{
 	curve(dnorm.trunc(x, medias[i], desvios[i], maximo=maximo, minimo=minimo),from=minimo, to=maximo,add=TRUE, col=cor[i])
 	} 
 	if(leg==TRUE)
 	{
 	 n.medias=medias + (maximo-minimo) * 0.05
 	text(n.medias[n.min], dnorm.trunc(medias[n.min], medias[n.min], desvios[n.min],maximo=maximo,minimo=minimo), labels=paste("sp",n.min,sep="_"), col=cor[n.min], cex=.7)
 	text(n.medias[-n.min], dnorm.trunc(medias[-n.min], medias[-n.min], desvios[-n.min],maximo=maximo,minimo=minimo), labels=(paste("sp",seqsp,sep="_")), col=cor[-n.min], cex=.7)
 	}
}  

In order to create the graph, we need to feed the function with the following information:

  1. the optimal values for each species1)
  2. the standard deviations of the species2)
  3. the minimum value for the gradient
  4. the maximum value for the gradient

How can we use this function? See the example below!

graf.com(medias=c(2,3,4,5,6,7,8), desvios=c(1,1,1,1,1,1,1), minimo=0, maximo=10)

It doesn't seem to be a very realistic community… In R it's very easy to generate sequences of random numbers from a known function. Follow the next commands in R and see what they are generating:

 
s1=seq(from=1.5, to=19.5, by=0.25)
s1
med=sample(s1, size=10)
med
desv <-runif(10,0.5,2.5)
desv
  • The first line creates an object called s1, which is a sequence of values from 1.5 to 19.5, in intervals of 0.253).
  • The second line just shows the value of s1.
  • The third line takes a sample of 10 values from s1 and stores it in the object mea.
  • The fourth second line just shows the value of mea.
  • The fifth line takes a sample of 10 numbers from the interval 0.5 to 2.5 and stores it in the object dev.
  • The sixth line just shows the value of dev.

Now we can use these objects in the function we have created above:

graf.com(medias=med, desvios=desv, minimo=0, maximo=20)

Take a look, casually, at the graph that your colleagues have created. Is their grass greener? Why do they graph look different than yours, as you have all followed the same tutorial and executed the same code? Run this code once:

par(mfrow=c(2,2))

Then run the following code four times:

graph.com(means=sample(2:19, size=10),sds=sample(seq(from=0.5, to=2.5, by=0.1),10), minimum=1, maximum=20)
  1. The first line in the code above divides the graphical window in four parts (2 lines and 2 columns). When you want to turn this off, simply close the open graphical window.
  2. The second line is the function that you already know.

After using the same command to create four virtual communities, what have you observed?

Discrete and Continuous Communities

  Do you remember the story, in the origins of ecological science, of two researches that had conflicting views about how communities were structured? One of them, Frederic Clements, had a very organized vision of plant communities, with a strong interdependence between the system species. He saw plant communities as a super-organism that is born, grows and dies. In contrast, the botanic Henry Gleason, at the same point in time, saw communities as a result of the interactions between the species and the environment, combined with random chance.

Great! Let's play with these contrasting ideas in our virtual environmental gradient! How can we play with these views? In the first (Clementsian World), communities are discrete, i.e., are comprised of a set of characteristic species which always occur together. On the other hand, on the Gleisonian World, species have different tolerance limits to environmental conditions and occur independently of the other, i.e., there are no clear boundaries between communities.

First let's put together a continuous community with 40 species on a 0-150 gradient:

  1. draw 40 values of an integer sequence from 10 to 150, to represent the optimum in the gradient of each species
  2. draw 40 values in a sequence beginning at 4 and going to 10, every 0.5, to define each species sds
  3. plot the graph of our virtual community using our graph.com function!
com.cont = sample (10: 150: 40)
dev = sample (seq (from = 4 to = 10, by = 0.5), 40, replace = TRUE)
graph.com (means = com.cont, sds = dev, minimum = 0, maximum = 150)

Generating discrete communities along the gradient is a little more complicated. Our species must form groups or associations, along the gradient. Let form four groups centered on the values 30, 60, 90 and 120 of our gradient. For each group we draw 10 species with some deviation around the central value. For this, we follow these steps:

  1. draw 10 points from a normal distribution with mean 30 and standard deviation 5, to represent our first 10 species
  2. repeat step one, but changing the mean to 60, 90 and 120
  3. we use the same sds values of the continuous community (object dev is already set up) for the species
  4. plot the graph of our virtual community using our graph.com function!
com1=rnorm(10, mean=30, sd=5)
com2=rnorm(10, mean=60, sd=5)
com3=rnorm(10, mean=90, sd=5)
com4=rnorm(10, mean=120, sd=5)
com.disc=c(com1,com2,com3,com4)
graph.com(means=com.disc, sds=desv, minimum=0, maximum=150)

Did you feel a sense of heavenly fulfillment? Now we have divine powers… we can create our own world! Nothing can stop us !!

Sampling from a Virtual Community

step2.jpeg

Let us return to our human condition and follow with a sample procedure for our community. Let's imagine that this gradient exists and that communities are exactly those we create, but we have no prior information about the systems. Because we are human and we want to understand how communities are structured, we can ask some questions, for example:

  1. Does this community respond to environmental gradient?
  2. If yes, this response is a gradual replacement of species along the gradient or formation of discrete subgroups of species in each region of the gradient?

To answer these questions, we must go to the system and study it. However, we do not have much money or time to study all kinds and all individuals that occur throughout the gradient, so we decide to make a sample. As this community is structured along a gradient, we can make the decision of proceeding about this sampling systematically rather than in a completely random fashion4). To do this we use two sampling functions below sample.com and prob.ssp. Copy and paste the code below in R:

sample.com=function(means, sds, sample, n.ind=100, minimum=0, maximum=150) {
  pnorm.trunc=function(x,minimum=-Inf, maximum=Inf, media=0, desvio=1)
  {
    denom <- pnorm(maximum, mean=media, sd=desvio) - pnorm(minimum, mean=media, sd=desvio)
      qtmp <- pnorm(x, mean=media, sd=desvio) - pnorm(minimum, mean=media, sd=desvio)
      qtmp/denom
  }
  nsp=length(means)
    nsample=length(sample)
    resulta=prob.resulta=matrix(0, nrow=nsp, ncol=nsample)
    sp.name=paste("sp", 1:nsp, sep="_")
    rownames(resulta)<-sp.name
    colnames(resulta)=paste("plot", 1:nsample, sep="_")
    for(k in 1:nsample)
    {
      for(i in 1:nsp)
      {
        prob.resulta[i,k]= pnorm.trunc(sample[k]+1,minimum=minimum, maximum=maximum,media=means[i], desvio=sds[i])- pnorm.trunc(sample[k],minimum=minimum, maximum=maximum,media=means[i], desvio=sds[i] )
      }
      s1=sample(sp.name, size=n.ind, prob=prob.resulta[,k], replace=TRUE)
        conta.s1=table(s1)
        pos.sp=match(names(conta.s1),sp.name)
        resulta[,k][pos.sp]<-conta.s1
    }
  return(resulta)
}

Now let's test if this works. Remember that we have already created the objects representing the mean and standard deviations of each of our communities. Now we just have to create an object that represents the sample of our community. Follow these steps:

  1. create a sequence of 14 values from 10 to 140. This values represent the places in the gradient where we will take the samples.
  2. sample the discrete community using the values we have generated above
  3. do the same with the continuous community
samp=seq(10,140, by=10)
samp
samp.disc<-sample.com(means=com.disc, sds=desv, sample=samp)
head(samp.disc)
samp.cont<-sample.com(means=com.cont, sds=desv, sample=samp)
head(samp.cont)

Comparing the Sample with the Virtual Communities

samplerro.jpg

Now we have created our virtual communities and sampled them along an environmental gradient. But is the sample a reliable representation of the patterns in our community? Let's see them side by side to compare.

par(mfrow=c(2,2))
graph.com(means=com.disc, sds=desv, minimum=0, maximum=140)
matplot(amost,t(amost.disc), type="l", lty=2, col=rainbow(dim(amost.disc)[1]), main="Sample",xlab='gradient value',ylab='individuals in parcel' )
graph.com(means=com.cont, sds=desv, minimum=0, maximum=140)
matplot(amost,t(amost.cont), type="l", lty=2, col=rainbow(dim(amost.cont)[1]), main="Sample",xlab='gradient value',ylab='individuals in parcel' )
par(mfrow=c(1,1))

Now we have a sample of the discrete community, in which species occur together in determined points of the gradient and a sample of the continuous community, in which species have their optimal points randomly spread in the gradient. Now we can use analytical methods to describe this communities and verify that these samples do capture the patterns we were looking for. We can also try to understand the limitations and advantages of the methods we have used - we will do so in the next tutorials.

Now you can try to create discrete and continuous communities with your own parameters.

To learn more

Walking the mortal world

After creating your own world, let's get back to the role of the ecologist that needs to analyze these samples and try to figure out the patterns. The following tutorials detail the analyses that are used to detect patterns from the variation in the abundance of species: * Grouping analysis, or cluster analysis. * Ordination analysis

Decrypt the code

If you want to understand the R functions better, look at a longer version of this tutorial here: * commented tutorial

1)
i.e., the mean of the normal distribution
2)
the higher the values, the more spread out along the gradient the individuals of this species will be
3)
the function being called is named seq
4)
this is debatable, but defensible
en/ecovirt/roteiro/comuni/comuni_virt1.txt · Last modified: 2017/10/24 09:44 by melina.leite