User Tools

Site Tools


en:ecovirt:roteiro:den_ind:di_tdr_passo

This is an old revision of the document!


Density-independent Dynamics in Discrete Time - R script

A population in which birth and death rates are constant grows independently of its own density. This situation is usually related to the absence of restriction on growth, when resources are unlimited, but it can also be associated with a depletion of resources and the extinction of the population.

Growth Rate

Let us now imagine a hypothetical population with constant growth and death rates and no migrations. At each time cycle related to a generation (T), the population size is the result of the number of individuals from the previous generation plus number of births (B), less deaths (D).

$$N_{T+1} = N_T + B - D $$

We can relate the number of deaths and births to a per capita value:

  • $B=bN_T$
  • $ D=dN_T $

where: b = birth rate per capita for each generation; d = mortality rate per capita for each generation. Note that the rate does not change with population size, however, the number of births and deaths is proportional to population size. Let's just clarify one more premise, for didactic purposes: births and mortalities occur simultaneously in the population (eg, an annual plant). Since T is the scale of a generation, we can then say that:

  • $N_{T+1} = N_T + bN_T-dN_T $
  • $N_{T+1} = N_T + (b-d)N_T $

if: $r_T = b-d$ ; discrete growth factor

  • $N_{T+1} = (1+r_T)N_T$
  • $\frac{N_{T+1}}{N_T} = 1+r_T$

Since $1+r_T$ is a constant, let's designate it as $\lambda$, a positive number that measures the proportional increase in population from one generation to the next. Therefore:

  • $\lambda=\frac{N_{T+1}}{N_T} $, or:

$$ N_{T+1} = \lambda N_T$$

Projecting the Population

We can then project our population to each time cycle (generations). For example:

If a population of 100 has a per capita birth rate of 0.8/year and a death rate of 0.75/year, what is the expected population size in the next year?

N0=100
lamb=1+(0.8-0.75)
Nt1=N0*lamb
Nt1

We can also project the population to other generations, using iterations:

(Nt2=Nt1*lamb)
(Nt3=Nt2*lamb)
(Nt4=Nt3*lamb)

Note that:

  • $N_{T4}= N_{T0} \lambda \lambda\lambda\lambda $
  • $N_{T4}= N_{T0} \lambda^4 $

This recursive equation can be written as:

$$N_{T}=\lambda^T N_0 $$

Let's take our previous example and design it for 10 time cycles.

N0=100
lamb=1+(0.8-0.75)
tmax=10
tseq=0:tmax
Nseq=N0*lamb^tseq
Nseq
plot(tseq, Nseq, type="l")

Initial Size

Let's now explore the initial population size.

  • $N_0 = 10,20,30, 40$
  • $\lambda = 1.5$
  • $time = 1:10$
tseq=0:10
lamb=1.5
N0=c(10,20,30,40)
N0.mat=matrix(N0, ncol=length(tseq), nrow=length(N0))
N0.mat
lamb_t=lamb^tseq
lambt_mat=matrix(lamb_t,ncol=length(tseq), nrow=length(N0), byrow=TRUE)
Nt=N0.mat*lambt_mat
colnames(Nt)<-paste("t", 0:10, sep="")
rownames(Nt)<-paste("N0", c(10,20,30,40), sep="_")
nt
matplot(0:10,t(Nt))

Let's now put the same graph on a logarithmic scale for the y-axis.

par(mfrow=c(1,2))
matplot(0:10,t(Nt))
matplot(0:10, t(Nt), log="y")

What's up?? It seems that all populations grow equally when we are on a logarithmic scale! Let's investigate the equation we are using, $N_t=\lambda^T N_0$ and take the log of both sides of the equation:

  • $log{N_T} = log{\lambda^T N_0}$
  • $ log{N_T} = (log{\lambda}) T + log{N_0} $

This equation resembles an equation of the line $ y=ax+b $, where the intercept is $log(N_0)$ and the slope is equal to $log{\lambda}$.

Challenge

  • Graphically show that the slope of the populations in the example above is equal to $log{(\lambda)}$.

Average Population Growth

pardal.jpg

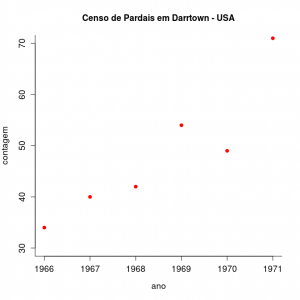
We will now investigate the population size data of a North American sparrow species (Melopiza melody) starting from the premise that this population grows in discrete time, since births occur in a short period of nesting time every year.

parda.png

The graph represents the singing sparrow count in the city of Darrtown, OH, USA. Download the data from the file pardal.txt on your computer.

Let's calculate the $\lambda$ for the first five intervals:

sparrow<-read.table("sparrow.txt", header=TRUE, sep="\t", as.is=TRUE)
str(sparrow)
head(sparrow)
sparrow6= sparrow[1:6,]
plot(sparrow6$Count ~sparrow6$Year)
lamb_pardal=pardal6$Count[2:6]/pardal6$Count[1:5]
lamb_sparrow

Now, let's calculate the population projection by the arithmetic and geometric mean of the $\lambda$ and draw the projections along with the observed data!

#arithmetic average
(lamb.art = mean(lamb_pardal))
#geometric average
(lamb.geo = prod(lamb_pardal)^(1/5))
tseq=0:5
plot(tseq, sparrow6$Count, pch=19)
N0=sparrow6$Count[1]
lines(tseq, N0*lamb.art^tseq, lty=2, col="red")
lines(tseq, N0*lamb.geo^tseq, lty=3, col="blue")
  • Which of the two means seems to fit the observed data better? Why?

Crescimento Discreto

Abaixo tem o código de uma função base para a projeção do crescimento de uma população, que pode ser usada como estrutura básica para outras funções que iremos desenvolver no curso. No caso, é uma funcão com 3 argumentos: número de indivíduos no tempo 0 (N0), taxa de crescimento populacional (lamb) e o tempo máximo (tmax) de projeção da população.

cresc.geom= function(No=100, lamb=1.04, tmax=10)
{
resulta <- rep(NA,tmax)
resulta[1] <- No
	for (i in 2:tmax)
	{
	tam=resulta[i-1]*lamb
	resulta[i]=tam
	}
return(resulta)
}

Ao copiar esse código na área de trabalho do R, um novo objeto é criado, de nome cresc.geom. Ele é um objeto da classe função que você pode usá-lo digitando o seu nome e especificando seus argumentos, como no exemplo a seguir:

 
resultado <- cresc.geom(No=10, lamb=0.98, tmax=100)

Note que o resultado da função, nesse caso, será guardado no objeto resultado. Para fazer um gráfico dos resultados pode utilizar o código abaixo:

plot(1:length(resultado), resultado)  

Estocasticidade Ambiental

Flutuações ambientais podem exercer efeito na taxa de crescimento instantâneo da população. De uma forma simples, podemos imaginar que essa variação funcione como um ruído no r, como se a população em média tivesse uma taxa, mas a cada realização ela pudesse ser um tanto diferente devido a condições externas a ela própria. A implementação dessa estocasticidade ambiental em modelos contínuos é um pouco mais complicada, mas podemos imaginá-la como realizações em algum intervalo pequeno de tempo. Para um crescimento discreto a construção de simulações com estocasticidade ambiental é mais intuitivo: a cada realização o Lambda é afetado pela variação ambiental. Vamos fazê-la.

npop=10
n0=10
lamb.med = 1.2
lamb.sd= 0.4
lamb = rnorm(npop, mean=lamb.med, sd=lamb.sd)
N0=rep(n0,npop)
N1=lamb*N0
lamb=rnorm(npop, mean=lamb.med, sd=lamb.sd)
N2=N1*lamb
N3=N2*rnorm(npop,mean=lamb.med,sd=lamb.sd)
N4=N3*rnorm(10,mean=lamb.med,sd=lamb.sd)
N5=N4*rnorm(10,mean=lamb.med,sd=lamb.sd)
Nt<-rbind(N0,N1,N2,N3,N4,N5)
matplot(0:5, Nt, type="l", lty=2:7)

Desafio

É possível adaptar a nossas função anterior de crescimento discreto para que possa também modelar populações com estocasticidade ambiental!

Dicas

O primeiro passo sempre e pensar quais argumentos vamos precisar Nesse caso, temos apenas mais um argumento o lamb.dp : o desvio padrão de lambda. O resto continua o mesmo, lembre-se que se o lamb.dp for 0, nosso população é determinística! Ou seja, a mesma função pode se prestar para simular ambos cenários.
en/ecovirt/roteiro/den_ind/di_tdr_passo.1663260870.txt.gz · Last modified: 2022/09/15 13:54 by adalardo