User Tools

Site Tools


en:ecovirt:roteiro:den_ind:di_tdr_passo

Density-independent Dynamics in Discrete Time - R script

A population in which birth and death rates are constant grows independently of its own density. This situation is usually related to the absence of restriction on growth, when resources are unlimited, but it can also be associated with a depletion of resources and the extinction of the population.

Growth Rate

Let us now imagine a hypothetical population with constant growth and death rates and no migrations. At each time cycle related to a generation (T), the population size is the result of the number of individuals from the previous generation plus number of births (B), less deaths (D).

$$N_{T+1} = N_T + B - D $$

We can relate the number of deaths and births to a per capita value:

  • $B=bN_T$
  • $ D=dN_T $

where: b = birth rate per capita for each generation; d = mortality rate per capita for each generation. Note that the rate does not change with population size, however, the number of births and deaths is proportional to population size. Let's just clarify one more premise, for didactic purposes: births and mortalities occur simultaneously in the population (eg, an annual plant). Since T is the scale of a generation, we can then say that:

  • $N_{T+1} = N_T + bN_T-dN_T $
  • $N_{T+1} = N_T + (b-d)N_T $

if: $r_T = b-d$ ; discrete growth factor

  • $N_{T+1} = (1+r_T)N_T$
  • $\frac{N_{T+1}}{N_T} = 1+r_T$

Since $1+r_T$ is a constant, let's designate it as $\lambda$, a positive number that measures the proportional increase in population from one generation to the next. Therefore:

  • $\lambda=\frac{N_{T+1}}{N_T} $, or:

$$ N_{T+1} = \lambda N_T$$

Projecting the Population

We can then project our population to each time cycle (generations). For example:

If a population of 100 has a per capita birth rate of 0.8/year and a death rate of 0.75/year, what is the expected population size in the next year?

N0=100
lamb=1+(0.8-0.75)
Nt1=N0*lamb
Nt1

We can also project the population to other generations, using iterations:

(Nt2=Nt1*lamb)
(Nt3=Nt2*lamb)
(Nt4=Nt3*lamb)

Note that:

  • $N_{T4}= N_{T0} \lambda \lambda\lambda\lambda $
  • $N_{T4}= N_{T0} \lambda^4 $

This recursive equation can be written as:

$$N_{T}=\lambda^T N_0 $$

Let's take our previous example and design it for 10 time cycles.

N0=100
lamb=1+(0.8-0.75)
tmax=10
tseq=0:tmax
Nseq=N0*lamb^tseq
Nseq
plot(tseq, Nseq, type="l")

Initial Size

Let's now explore the initial population size.

  • $N_0 = 10,20,30, 40$
  • $\lambda = 1.5$
  • $time = 1:10$
tseq=0:10
lamb=1.5
N0=c(10,20,30,40)
N0.mat=matrix(N0, ncol=length(tseq), nrow=length(N0))
N0.mat
lamb_t=lamb^tseq
lambt_mat=matrix(lamb_t,ncol=length(tseq), nrow=length(N0), byrow=TRUE)
Nt=N0.mat*lambt_mat
colnames(Nt)<-paste("t", 0:10, sep="")
rownames(Nt)<-paste("N0", c(10,20,30,40), sep="_")
nt
matplot(0:10,t(Nt))

Let's now put the same graph on a logarithmic scale for the y-axis.

par(mfrow=c(1,2))
matplot(0:10,t(Nt))
matplot(0:10, t(Nt), log="y")

What's up?? It seems that all populations grow equally when we are on a logarithmic scale! Let's investigate the equation we are using, $N_t=\lambda^T N_0$ and take the log of both sides of the equation:

  • $log{N_T} = log{\lambda^T N_0}$
  • $ log{N_T} = (log{\lambda}) T + log{N_0} $

This equation resembles an equation of the line $ y=ax+b $, where the intercept is $log(N_0)$ and the slope is equal to $log{\lambda}$.

Challenge

  • Graphically show that the slope of the populations in the example above is equal to $log{(\lambda)}$.

Average Population Growth

pardal.jpg

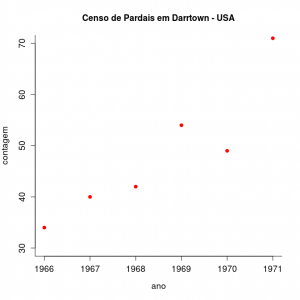
We will now investigate the population size data of a North American sparrow species (Melopiza melody) starting from the premise that this population grows in discrete time, since births occur in a short period of nesting time every year.

parda.png

The graph represents the singing sparrow count in the city of Darrtown, OH, USA. Download the data from the file pardal.txt on your computer.

Let's calculate the $\lambda$ for the first five intervals:

sparrow<-read.table("sparrow.txt", header=TRUE, sep="\t", as.is=TRUE)
str(sparrow)
head(sparrow)
sparrow6= sparrow[1:6,]
plot(sparrow6$Count ~sparrow6$Year)
lamb_pardal=pardal6$Count[2:6]/pardal6$Count[1:5]
lamb_sparrow

Now, let's calculate the population projection by the arithmetic and geometric mean of the $\lambda$ and draw the projections along with the observed data!

#arithmetic average
(lamb.art = mean(lamb_pardal))
#geometric average
(lamb.geo = prod(lamb_pardal)^(1/5))
tseq=0:5
plot(tseq, sparrow6$Count, pch=19)
N0=sparrow6$Count[1]
lines(tseq, N0*lamb.art^tseq, lty=2, col="red")
lines(tseq, N0*lamb.geo^tseq, lty=3, col="blue")
  • Which of the two means seems to fit the observed data better? Why?

Discrete Time Growth

Below is the code of a base function for projecting the growth of a population, which can be used as a basic structure for other functions that we will develop in the course. In this case, it is a function with 3 arguments: number of individuals at time 0 (N0), population growth rate (lamb) and maximum time (tmax) of population projection.

cresc.geom= function(No=100, lamb=1.04, tmax=10)
{
result <- rep(NA,tmax)
result[1] <- No
for (i in 2:tmax)
{
tam=result[i-1]*lamb
result[i]=tam
}
return(result)
}

By copying this code to the R desktop, a new object is created, named cresc.geom. It is an object of the function class that you can use it by typing its name and specifying its arguments, as in the following example:

result <- cresc.geom(No=10, lamb=0.98, tmax=100)

Note that the result of the function, in this case, will be stored in the object result. To graph the results you can use the code below:

plot(1:length(result), result)

Environmental Stochasticity

Environmental fluctuations can have an effect on the instantaneous population growth rate. In a simple way, we can imagine that this variation works like a noise in r, as if the population on average had a rate, but at each realization it could be somewhat different due to conditions external to itself. The implementation of this environmental stochasticity in continuous models is a little more complicated, but we can imagine it as realizations in some small time interval. For a discrete growth, the construction of simulations with environmental stochasticity is more intuitive: at each realization the Lambda is affected by the environmental variation. Let's do it.

npop=10
n0=10
lamb.med = 1.2
lamb.sd= 0.4
lamb = rnorm(npop, mean=lamb.med, sd=lamb.sd)
N0=rep(n0,npop)
N1=lamb*N0
lamb=rnorm(npop, mean=lamb.med, sd=lamb.sd)
N2=N1*lamb
N3=N2*rnorm(npop,mean=lamb.med,sd=lamb.sd)
N4=N3*rnorm(10,mean=lamb.med,sd=lamb.sd)
N5=N4*rnorm(10,mean=lamb.med,sd=lamb.sd)
Nt<-rbind(N0,N1,N2,N3,N4,N5)
matplot(0:5, Nt, type="l", lty=2:7)

Challenge

It is possible to adapt our previous discrete growth function so that it can also model populations with environmental stochasticity!

Tips

The first step is always to think about what arguments we will need In this case, we only have one more argument o lamb.dp : the standard deviation of lambda. The rest remains the same, remember that if lamb.dp is 0, our population is deterministic! That is, the same function can be used to simulate both scenarios.
en/ecovirt/roteiro/den_ind/di_tdr_passo.txt · Last modified: 2022/09/15 13:59 by adalardo