Table of Contents
Population matrix models - Tutorial in spreadsheets
Leslie/Leftkovitch Matrices
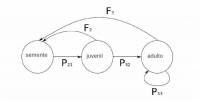
 The growth of a population with an age structure can the projected using matrix algebra. Leslie matrices have the information about birth and death rates of different age classes of a population and are a robust way of figuring out the population growth and make projections for different scenarios. A generalization of the Leslie matrix occurs when the population is classified due to development stages instead of age classes (Lefkovitch matrices). In this scenario, an individual may reproduce, die, grow from one stage to another, or stay in the same stage. In this generalization, the basic vital rates are built into the transition matrix elements, which are used to figure out the effect that individuals from having a number of individuals in each class on the number of individuals in each class at the next time step.
Objective
The objective of this exercise is understand how can we study structured populations with these matrix models.
Before that, let's make some matrix multiplications in a spreadsheet.
Multiplying Matrices
Let's use one of the examples in Chapter 5 of the book Vegetable Ecology (Gurevitch et al. 2009) (see bibliography).
- 1. Prepare the population matrix of the cacti Escobaria robbinsorum from “Local C” (pag. 111) and mount it in a spreadsheet (Excel or Calc, for example) (or open cactus2010.xls for an already created spreadsheet)
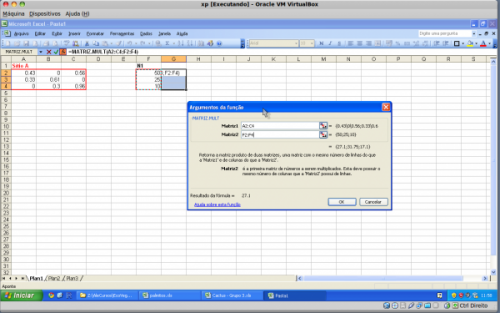
- 2. Multiply the populaion size vector (number of individuals from t1 - “N1” in the spreadsheet) by the transition matrix. To do that, put the cursos in the cell
I4, then click the INSERT / FORMULA / MATRIX (Excel) or INSERT / FUNCTION / MATRIX (Calc) menu and choose the matrix multiplication function, (M.MULT or MATRIX.MULT depending on the program version). Indicate in the function dialog box, what should be multiplied: first the transition matrix and then the population vector. Attention: before any movement (or breathing) do steps 3 and 4 , otherwise you run into the infinite vortex of Excel !!
- 3. In the function dialog box, place the $ symbol in front of the letters and numbers of the selection code of columns and rows referring to the location of the transition matrix in the worksheet (eg “ $ C $ 4: $ E $ 6 ”). This sets the selection of the transition matrix in the formula and helps design the population in Excel automatically, without the need to redo the previous step for each time. Do not fix population size vector !! This is not what you want !!!
- 4. The multiplication result is a vector (
N2) with the number of individuals at the next time instant (t + 1) for each of the classes (the three rows in columnN2).
Don't panic!
- Select the cell of the first class result along with the cells where the values relative to each of the other classes should be (in the “N2” vector);
- after that press the F2 key (to open the formula) and then Control + Shift + Enter (command to paste the formula into the selection cells).
That should solve! The three rows of the column referring to the vector “N2” must be filled at the end of this operation.
Note: If you have a MacOS computer, the sequence of keys to be pressed is a bit different. Press the control + U keys and then command + return (or command + enter)
- 5. To project the population to future time (N3, N4, etc.), you can proceed in two different ways: 1) Select any vector (the three cells of the column with the result - make sure that the formula is with the symbols
$), copy and paste in the next column. Repeat this procedure for multiple columns (that is, multiple future times) to the column you want to project the population to; 2) Select any vector (the three cells of the column with the result - make sure the formula is with the symbols$), then find the+sign that appears in the lower right corner position the mouse, click and drag horizontally to the column you want to project the population.
Do not panic!
- 6. After projecting the population over several times (preferably over 15 times), produce a graph with the size of each class over time. Also chart the total population over time. To obtain the total population, simply sum the classes of each vector. Check what happens to the size of classes and the population as a whole.
- 7. Now plot the proportion of individuals in each class over time. Check what happens to the distribution of class proportions after some time.
- 8. Calculate how the total population has grown from one time to another $(\frac{N_t + 1}{N_t}$) and plot the population growth rate over time .
Is palm heart extraction sustainable?
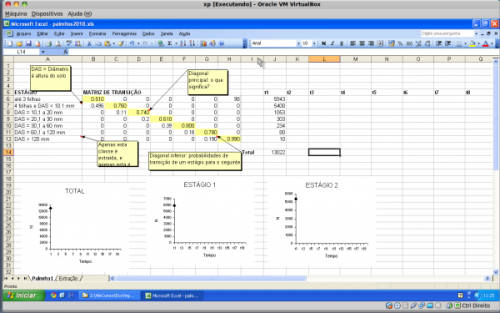
- 1. Download and open the palmitos2011.xls worksheet. This is the transition matrix for a palm heart population ( Euterpe edulis Mart.) In the Santa Genebra Reserve, Campinas (Silva Matos et al., 1999).
Understanding the worksheet
Note that the matrix is based on stages of development rather than age classes, so it is possible for individuals to remain in the same class from one time to another. In these cases, the transition matrix (called the Leftkovitch Matrix) also has probabilities of permanence. Find the probabilities of staying in the matrix.
- 2. Let's first calculate the asymptotic growth rate (λ). This is the value of stabilizing the growth rate when projecting for many time intervals. For this we only need to reproduce the steps of the previous exercise. Note: now the transition matrix is larger and all of it must be selected and fixed in the matrix multiplication formula.
- 3. Also calculate the stable class distribution, ie the proportion of each class in relation to the total population in equilibrium.
- 4. We will evaluate the impact of the extraction of reproductive adults on this population. We will model the extraction of a fixed fraction of adults each year before they reproduce. We will do this with the same file, but in the second worksheet / tab (called “Extraction”). The percentage of extracted adults should be placed in the “M2” cell.
- 5. Use the RESULTS TABLE, which is located just below on the same worksheet, to store your results. The columns represent each time instant and the rows the classes concerning the stages of development. Copy to the first column the population size vector at time 1. Note: To copy the multiplication results for the second column of the table (time 2) use the EDIT / PASTE SPECIAL / VALUES option.
- 6. For the next time, you must repeat the vector calculations. But in that spreadsheet it will be a bit different. For each next time it will be necessary to copy the vector with the result of the previous multiplication (column “L”) and paste ( Note: with EDIT / PASTE SPECIAL / VALUES! ) in the place where the population vector is (ie in the
Jcolumn). In this way, the results of the multiplication formula will be updated, resulting in the values for the next time (ie the new values that will appear in theLcolumn). Each time you should copy these new values to the RESULTS TABLE, in the corresponding column. Repeat this until time 15 or more.
SHORTCUT
- If you _already have experience with formulas in Excel_ and want an alternate path to automate calculation, avoiding COPY / PASTE SPECIAL errors, follow the steps below:
- Repeat steps 1 through 5 of the previous section (cactus exercise) to multiply the matrices. Set the percentage extraction values of the formula in the cell
L12using the$. The formula should look like this:= K12 * (100- $ M $ 2) / 100. Copy and paste the cellsK6: L12(you can select the two columns at the same time) in theM6cell. Two new columns of numbers should appear. The second column represents the population values after extraction. Repeat this procedure by always pasting the cells side by side. - In the RESULTS TABLE, simply put in the cell
C18the formula= L6, enter and drag to complete all the cells referring to the size classes at time t2. For time t3, in cellD18type= N6and copy to other size classes, for time t4, in cellE18type= P6and copy to the other size classes, and so on, always remembering to skip a column. - NOTE: If you are not experienced with formulas in Excel, do not waste time trying to understand this shortcut. Try at home later!
- 7. Compare the projected population growth in scenarios with and without adult extraction. Vary the extraction percentage as you wish (test at least three different extraction percentages).
- 8. Make a single 100% extraction of adults in the first cycle and see if the population can recover or decline to extinction. Also get the time it takes for one of these results to occur.
To learn more
Gotelli, N. J. 2007. Ecologia. Cap.3- Crescimento Populacional Estruturado. Pp. 49-82. Ed. Planta.
Gurevitch, J, Scheiner, S.M, Fox, G.A. 2009. Ecologia Vegetal. Cap. 5 - Ed. Artmed, São Paulo.
An Intuitive Guide to Linear Algebra, from Better explained.
Freckleton, R.P., Silva Matos, D.M., Bovi, M.L.A & Watkinson, A.R. 2003. Predicting the impacts of harvesting using structured population models: the importance of density-dependence and timing of harvest for a tropical palm tree. Journal of Applied Ecology, 40: 846-858.
Silva Matos, D.M., Freckleton, R.P. & Watkinson, A.R. 1999. The role of density dependence in the population dynamics of a tropical palm. Ecology, 80: 2635-2650.
Stubben, C., & Milligan, B. (2007). Estimating and analyzing demographic models using the popbio package in R. Journal of Statistical Software, 22(11), 1-23.

