This translation is older than the original page and might be outdated. See what has changed.

User Tools

Site Tools


en:ecovirt:roteiro:den_ind:di_ea_base

BASE

Density independent growth with environmental stochasticity

God-playing-dice-zendope.com_1.jpg

In the density-independent population dynamics tutorial, we predicted the population size by multiplying the initial size $N_0$ by the same growth rate $\lambda$ at every generation $t$:

\begin{equation} N_t=N_0 \lambda^t \label{eq1} \end{equation}

By doing this, we are assuming that the growth rate is the same at each generation, which is far from realistic. Resources and environmental conditions vary with time, which must make $\lambda$ drift. If we accept this, calling $\lambda_i$ the growth rate at each generation1), our model becomes:

\begin{equation} N_t=N_0 \lambda_1 \lambda_2 \lambda_3 \ldots \lambda_t \ = \ N_0 \prod_{i=1}^t \lambda_i \label{eq2} \end{equation}

We still have an average growth rate, that we can estimate by averaging the observed growth rates over the generations. Is the environmental conditions are nearly constant, the observed rates must be close to this average most of the time, which means that the $\lambda_i$ should have a small variance2). If there is a lot of environmental variability, the growth rates will be more variable as well. We call the uncertainty in the demographic rates due to fluctuations in resources and environmental conditions environmental stochasticity.

Simulating environmental stochasticity

How does environmental stochasticity affects the population size projections? Let's answer this by simulating the discrete growth model (equation $\ref{eq2}$), with values for $\lambda_i$ that change for each generation. We have chosen the discrete model for educational purposes, but the conclusions carry over to the continuous time model.

Parâmetros

The parameters of our model:

Option parameter
Enter name for last simulation data set R object name
Maximum timetmax
Number of stochastic simulationsnpop
Initial population sizeN0
Population mean growth ratelambda
lambda variance varr
Population extinctionext=TRUE

What's in the graph?

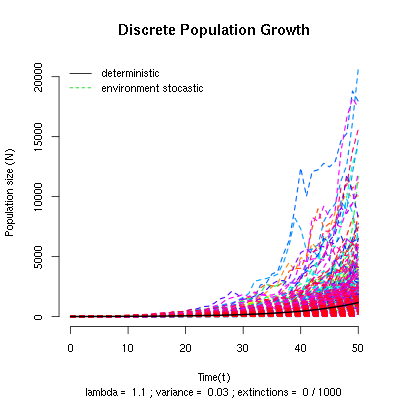
Each colored line is the time projection of the size of one population, according to the model ($\ref{eq2}$). Each population has the same mean growth rate and the same initial size. The projections are different, because at each time step a different growth rate is drafted independently for each population.

The drafts are made from a probability distribution called lognormal, which makes all rates positive, as the model demands. You can change the average and variance parameters used in the drafts (see below). The higher the environmental stochasticity, the higher should be the variance of the growth rates.

The black line shows a projection of a population under a constant growth rate equal to the average of the probability distribution. Although the model is discrete, we have represented the population projections with lines to facilitate the visualization of the trajectories over time.

Becoming familiar with the simulations

Our objective is to understand the effects of environmental stochasticity over the density independent discrete population growth. We should start by seeing just one population at a time.

- Change the value of Maximum time to 10 - Change the value of Number of stochastic simulations to 1 - Change the value of Population growth rate (lambda) to 2.0 - Click OK - Repeat the operation a couple of times and observe how the graph changes - Now repeat it with more environmental stochasticity. To do this, increase the value of lambda variance and observe the graph

Every time you click the OK button, the software drafts new values for $\lambda$ for each time interval, and uses them to predict the population size over time according to equation $\ref{eq2}$.

The numbers are drafted from the same probability distribution, with mean and variance specified in the options window. The drafts are independent, that is, the value drafted in a time step does not affect the subsequent drafts. Because of that, we call this rates independent and identically distributed random variables.

Questions

- What is necessary to simulate a constant environment in this tutorial? - What is the behavior of the projections with no environmental stochasticity? Check your answer with EcoVirtual

Averaging over several projections

A common way of dealing with variable processes is to the describe their average behavior. For example, here you can find a real-time graph of the traffic in the city of São Paulo over each hour, today and in comparison with historical average, maximum and minimum values for each hour. The percentage of streets with traffic jams varies everyday, but that does not mean it is totally unpredictable. If we gather data from lots of different days, we can have an idea of what to expect, and we can assess whether or not we are in an atypical day. The expected value of a variable, $E[X]$, is the theoretical average of a random variable $X$3), in our case the percentage of streets having a traffic jam at a given hour.

In our simulations, the population sizes are the result of a multiplication of growth rates that are drafted always from the same probability distribution. If these products have an expected value, we can predict the average behavior of the populations, even with the uncertainty coming from environmental stochasticity. Is this possible?

Let's assess this by predicting several independent populations, in order to have lots of population sizes for each time interval. To do this, enter the following values in the function

# store the results in an object called "sim1"

tmax = 51
npop = 1000
N0 = 10
lambda = 1.1
varr = 0.03
ext = FALSE

You will see a graph with the independent evolution of 1000 populations over time following the model in ($\ref{eq2}$), with an average $\lambda$ of 1.1 and variance of 0.03.

By naming the object created, you have recorded the population size projections in the memory of the R environment, as a data table in which the columns are the population sizes and the lines are the time intervals. That's what we need to calculate the average size of the populations for each time interval!

continuação modelagem

## Removes the two first columns (which have the time and deterministic solution)
sim1b <- sim1[,-(1:2)]

## Averages the population for each time
means=apply(sim1b,1,mean)

## What is the maximum time
time <- length(means)-1

## Plots the mean of the simulations
plot(0:time,means, xlab="Time", ylab="N")

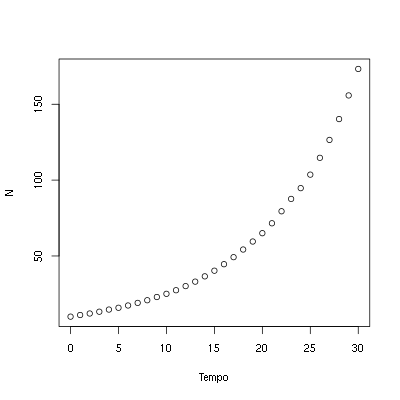
Now click on Submit to send these commands to R. If everything went well, the graph will show something like this:

env_stoc_medias.png

The averages seem to have a geometric growth, just like the discrete growth model without stochasticity. Let's see this for the first five projected values. Copy the following lines in the Script window and click Submit:

# Average of the projected populations from time t=0 to t=5
means[1:6]

The projected population for the average $\lambda$ is:

10*1.1^(0:5)

We can also add the deterministic projection to the graph, by using the commands

points(0:time, 10*1.1^(0:time), pch=19, col="blue", cex=0.5)
legend("topleft", c("observed population mean", "average pop projection"),
		pch=c(1,19), col=c("black", "blue"))
Question

Seeing the results you have reached with the model of discrete growth with environmental stochasticity, following equation $\ref{eq2}$:

$$N_t \ = \ N_0 \prod_{i=1}^t \lambda_i$$

If we define the average of the values of $\lambda_i$ as

$$\bar \lambda \ = \ E[\lambda_i]$$

Propose an equation for the expected value of the population size $E[N_t]$ as a function of $\bar \lambda$.

Variance of several projections

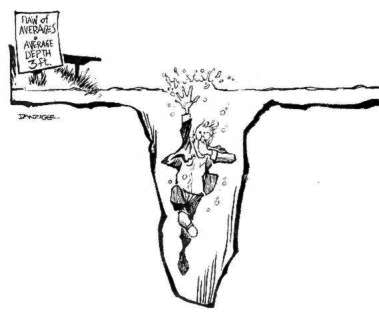
statistician drowning in a pond with an average depth of 3ft

Last section showed that even with environmental stochasticity, the population projections are, on average, the same as the model without stochasticity.

That's a welcome result, but averages can be misleading, as would say the statistician who drowned in a pond with an average depth of 3 feet. The missing information is how much variability there is in the data. One way to measure it is the variance, which measures the expected deviation of the data from the mean. For any random variable $X$, the theoretical variance is:

$$VAR[X] \ = \ E[(X - E[X])^2]$$

Notice that the variance is the mean of the deviations from the mean. This deviation is squared because of some convenient mathematical properties4). Because of that, the variance is also known as mean squared deviation.

There is an inconvenience in expressing the variability with squared deviations: the unit of variance is the square of the original units. If the mean is expressed in centimeters, the variance will be expressed in square centimeters :-?. This is solved by taking the square root of the variance, which is called standard deviation/.

Cute, but how do I apply this?

The expression above for the variance is a theoretical definition. In practice, we often don't know the theoretical expectations - but we can estimate them from a data set. If we suppose these data are a representative sample of the process we want to represent, in a sample of $n$ measures we can estimate the variance as:

$$s^2 \ = \ \sum_{i=1}^n \frac{(x_i - \bar x)^2}{n-1}$$

Here $\bar x$ is the estimator for the mean

$$\bar x \ = \ \frac{1}{n}\sum_{i=1}^n x_i $$

And $n$ is the sample size (or the number of measures). The standard deviation is estimated as the square root of $s^2$:

$$s \ = \ \sqrt{\sum_{i=1}^n\frac{(x_i - \bar x)^2}{n-1}} $$

Standard deviation of the population projections

With this knowledge, we can assess how our population growth model with environmental stochasticity varies over time. Let's use the projections made in our last simulation, that should be still on the memory. To create a graph of the average and standard deviation as a function of time, copy and run the following commands in R:

## computes the standard deviation for each time step
devs <- apply(sim1b,1,sd)
## Plots the means...
plot(0:time,means, xlab="Time", ylab="N")
## And superposes the standard deviations
points(0:time,devs, xlab="Time", ylab="N", col="blue")
## Adds a legend
legend("topleft", c("means", "standard deviations"),
	pch=c(1,1), col=c("black", "blue"))

The standard deviation also growths exponentially over time!! The growth can be even faster than the mean population growth, as happens with the simulation we used here.

Looking at the standard deviation as a measure of our uncertainties, we can say that long-term projections are extremely imprecise, even with known average. Now that you know all of this, run some new simulations and look at the graphs. They should look like this:

estoc_amb_projecao2.png

Notice that the amplitude of the projections opens up like a funnel as time passes. That happens because the trajectories diverge with the multiplication of the variable rates, even with populations that started out with the same number of individuals.

Extinction risk

The variance and standard deviation are averages (of the deviation), and as such, may not fully characterize the structure of the data variability. Consider these two sets5):

Set A
456789101112131415
set B
8888888888819

For both sets, the mean is 9 and the variance is exactly 11. What eludes the statistical measures is the distribution of values around the mean, which is more asymmetric in set B, where only one value is greater than the average.

Now look again at the population projection graphs from the last section and assess the symmetry of the distribution of values in respect to the mean, represented by the black line. To help you, the following R code makes histograms of the projections on times 5, 10, 20 and 30:

## maximum value (to set the scale of the histogram)
sim1b.m <- (max(sim1b[c(6,11,21,31),]))
## creates a new window with 4 graphs
par(mfrow=c(2,2))
## creates the histograms
	hist(sim1b[6,], xlab="N", ylab="Frequency", main="T=5",
			breaks=seq(0,max(sim1b[6,]+50),by=50), xlim=c(0,sim1b.m))
	hist(sim1b[11,], xlab="", ylab="", main="T=10",
			breaks=seq(0,max(sim1b[11,]+50),by=50), xlim=c(0,sim1b.m))
	hist(sim1b[21,], xlab="", ylab="", main="T=20",
			breaks=seq(0,max(sim1b[21,]+50),by=50), xlim=c(0,sim1b.m))
	hist(sim1b[31,], xlab="", ylab="", main="T=30",
			breaks=seq(0,max(sim1b[31,]+50),by=50), xlim=c(0,sim1b.m))
## Returns the original parameters
par(mfrow=c(1,1))

The projection distributions become more and more asymmetric as time passes. This happens because a few populations grow a lot, while most stay at small sizes. Depending on the mean and variance of the growth rate, several populations may even become smaller than the starting population size.

Even with a mean growth rate bigger than 1 ($\bar \lambda>1$), the environmental stochasticity may cause a decrease in the population size! Let's see this by counting how many populations exceeds the initial size on a simulation with large variance for $\lambda$.

Simulate with the folowing parameters:

# salve the results in an R object:'sim2'
tmax = 51
npop = 1000
N0 = 10
lambda = 1.05
varr = 0.2
ext = FALSE

The results will be stored on the R memory, in a new object called sim2. We can now figure out the proportion of the 1000 simulated populations that reached a higher size than $N_0=10$ for every time step. To do this, copy the following commands in the Script window and click Submit:

greaterN0 <- apply(sim2[,-(1:2)],1,
	function(x)sum(x>10)/length(x))
plot(sim2[-1,1],maiorN0[-1], xlab="Time", 
	ylab="Projections over > N0")

The proportion of projections greater than $N_0$ falls with passing time. This shows that the probability of a population to grow gets smaller, even if on average there is growth 8-O.

This seeming paradox can be explained by the strong asymmetry of the distributions: most populations will stay below average, a fact that becomes stronger with time6). Also: if the environmental variability7) is big, at every time step a smaller proportion of the populations will be greater than any fixed number.

Question

Let's define a minimum population size, $N_{min}$, under which we consider that the population is extinct8). In the options window, the option Population extinction runs the simulations with $N_{min}=1$, that is, every population that falls below $N = 1$ is considered extinct9). The number of populations that went extinct after the simulation will be printed below the X axis. Use this simulations to find out:

- What is the effect of environmental stochasticity on the extinction probability? - For a fixed level of stochasticity, what is the effect of increasing the simulation time? - What is the consequence of these results to the conservation of endangered populations?

A good estimate of a probability of an event is the frequency in which it occurs after a large number of trials. So, use a large number of populations in our simulations. In some cases the graph may become very crowded with lines, but the number of extinctions is always below the X axis.

To learn more

* On population growth in a randomly varying environment: in this classical paper, Richard Lewontin and Dan Cohen drew the attention of the biologists for the surprising properties of the models we have explored here.

* R tutorial for the multiplication of random variables: see how the model we have used converges to a log-normal distribution. From the course on statistic modelling of the ecology graduate programme of the University of São Paulo.

* Life is log-normal: a thought-provoking argumentation in favor of using lognormal instead of normal, with links for an animated demonstration.

1)
$i=1 , 2, 3, \ldots t$
2)
further in this tutorial we will define precisely what variance is. For now, think of it as a measure of how much the data varies
3)
that is, a variable that can assume different values
4)
in order to see these properties and learn how to estimate the variance of a dataset, look here
5)
these data are part of a group of datasets create by the statistician Francis Anscombe to illustrate some pitfalls of statistical measures. See more here
6)
it's possible to prove this result more rigorously. With the passing of time, the projections distribution tends to a lognormal with growing variance, which becomes increasingly more asymmetric
7)
represented here by the $\lambda$ variance
8)
in other words: $N_t<N_{min} \implies N_t=0$
9)
$N_{min}=1$ looks like a natural choice, but if we are representing a population density by $N$ instead of the absolute number of individuals, other values are more appropriate
en/ecovirt/roteiro/den_ind/di_ea_base.txt · Last modified: 2022/09/19 13:35 (external edit)