Table of Contents
Successional matrix models
Matrix algebra can be used to model the state transitions of a set of habitat patches, just like we did for the states of individuals in a population in the models of Leslie and Lefkowitch (do you remember them?). Behind these models are also Markov chains, to which we will return when we study the Hubbell Neutral model. The idea here is exactly the same as in matrix models for populations. We will create a transition matrix representing the likelihood of transition from each state to another over time, which multiplied by a vector containing the number of patches in each state gives us the number of patches in each state in the next time interval. We will build these models in Excel just as we did with populations of palm trees, including also a disturbance term, which represents deforestation.
- 1. Create a matrix with the following structure:
| status at time t | |||||
|---|---|---|---|---|---|
| Open | Herbaceous | Shrubby | Forest | ||
| status at t+1 | Open | 0,10 | 0,10 | 0,10 | 0,01 |
| Herbaceous | 0,90 | 0,10 | 0,00 | 0,00 | |
| Shrubby | 0,00 | 0,80 | 0,10 | 0,00 | |
| Forest | 0,00 | 0,00 | 0,80 | 0,99 | |
- 2. Now create a vector with the number of patches in each state at the initial time:
| Number of patches at start | |
|---|---|
| Open | 1000 |
| Herbaceous | 10 |
| Shrubby | 5 |
| Forest | 0 |
- 3. Next, multiply the matrix by the vector using the same function that we used on the previous exercise;
- 4. Make population projections for 20 time intervals
Matrix multiplication
To remember matrix multiplication in Excel we will resume the explanation of the exercise on population dynamics. If you have any doubt, go to the script in Population matrix models - Tutorial in spreadsheets.
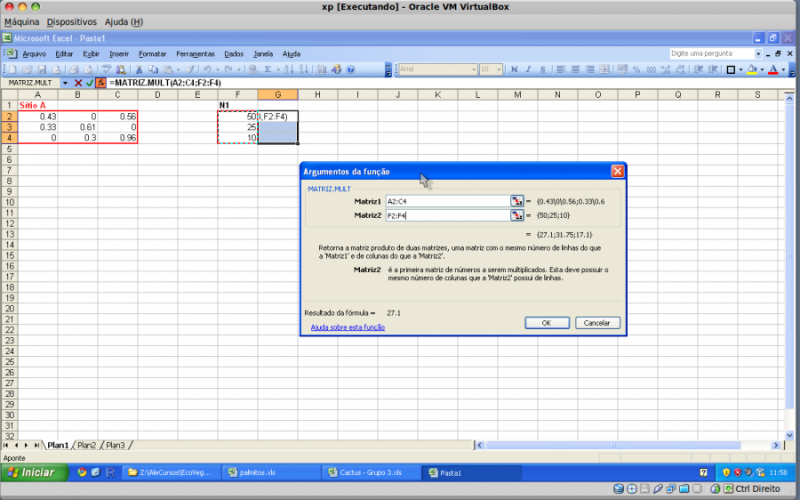
- 1.1. Prepare the transition matrix for the vegetation states and the number of patches in the starting time in an Excel worksheet, as indicated above. If you have any doubt, open the worksheet on cactus to see the version that was created to study the population dynamics.
- 1.2. Multiply the vector by the transition matrix. To do so, click on the menu Insert/Formula/Matrix and chose the matrix multiplication formula (which may be called M.MULT, but depends on the program version). Indicate on the dialog box the transition matrix and the population vector. Click “OK” to run.
In the formula for the multiplication, you can put the \$ symbol in the rows and columns selection for the transition matrix (ex: \$C\$4:\$E\$6). This will “freeze” the selection in the formula, and may help you to make projections for the population size. The result of this multiplication is a vector (N2) with the number of individuals in the next time step (t+1) for each stage. If the formula does not produce a vector, select the cells with the formula and the next lines, related to each class for the time t+1, press F2 (to open the formula) and then Control+Shift+Enter. That should fix it!
Warning: after you do the trick above, whenever you try to change a cell in the matrix, Excel will show an error message. You can't escape this trap with Enter, but you can press Esc to exit.
- 1.3 Redo the step 1.2 several times and create a graph with the number in each stage in the time sequence (>10). If you have fixed the cells for the matrix as explained above, you can simply select the cells with the first multiplication and drag the cursor to the left, and the program will automatically redo the calculations for the next time steps!
Kinds of succession
From this first example, you can create the following situations in different worksheets:
- 1. A scenario of primary succession, and another of secondary succession,
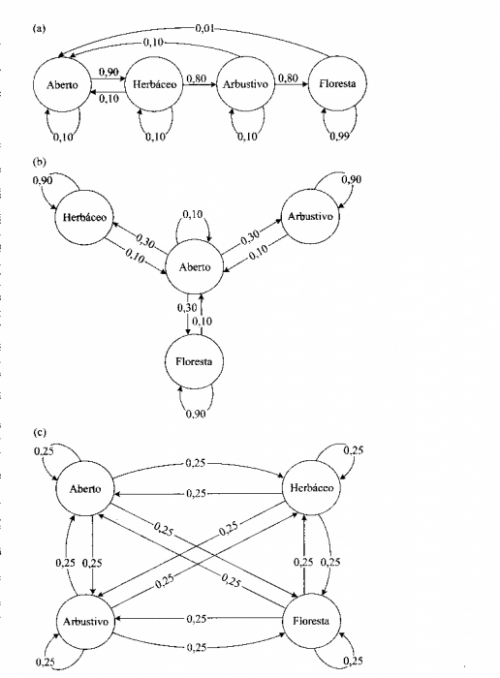
- 2. Models of succession by (a) facilitation, (b) inhibition and © tolerance, and compare them. See the figure for examples.
- 3. Increase the disturbance in the stage of Forest (transition to Open) and see how the system behaves for each model above.
Answer:
- Which of these models more closely resembles the succession in forests? Why?
- Are there any difference in the trajectory or end results for primary and secondary succession?
- Increasing the disturbance may cause the elimination of one of the stages? Why?
Desert vegetation
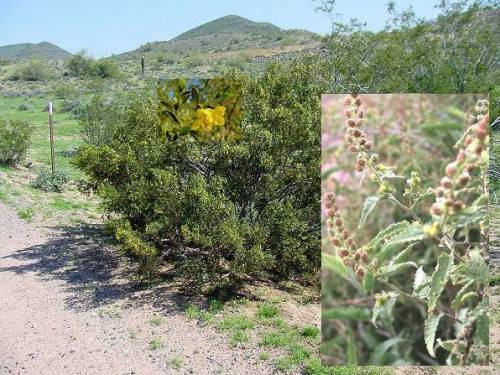
Working on the Sonora desert (Californa, USA), McAuliffe observed the dynamic of the desert for three very slow successional stages. These stages are characterized by the greasewood (Larrea tridentata), the canyon ragweed (Ambrosia ambrosioides) and open spaces.
 In the center of the photo you can see the greasewood (Larrea tridentata), a shrub that can grow to a small tree and in the right side a detail on the ragweed.
The transition matrix created after the data collection is the following:
| stages at time t | ||||
|---|---|---|---|---|
| Open | Ambrosia | Larrea | ||
| t+1 | Open | 0,99854 | 0,031 | 0,0016 |
| Ambrosia | 0,0013 | 0,96842 | 0 | |
| Larrea | 0,00016 | 0,00058 | 0,9984 | |
Draw a diagram for this model, and create a transition worksheet on Excel.
- 1. In which of the types of succession the dynamics of this matrix can be classified?
- 2. Can you identify any kind of facilitation in the system? If so, how can it be measured?
- 3. What is the expected distribution of stages in equilibrium for this system?1)
- 4. How much time would the system need to reach an equilibrium if a disturbance caused all the patches to become empty?
- 5. Does the equilibrium state changes if you started from a scenario in which all patches are occupied by Larrea? How long would it take?
Observed distribution
The same study above also measured the frequency of patches in each state. The collected data are:
| | ^ Observed frequency ^
^ State ^ Open | 0,99854 |
|::: ^ //Ambrosia// | 0,0013 |
|::: ^ //Larrea// | 0,00016 |
Compare the observed values with those estimated by the matrix model.
- Is there any correspondence between the observed and the expected?
- Which stage is further away from the expected?
- Indicate a possible reason for this disagreement.
To learn more
- Gotelli, N. 2007. Ecologia. Editora Planta. Londrina - Chapter 8.
- MacAuliffe, J.R. 1988. Markovian dynamics of simple and complex desert plant communities. The American Naturalist 131: 459-490.

