−Table of Contents
Density dependence in structured populations - Tutorial in Spreadsheets
The basic model of transition matrices does not include any kind of restriction on the increase of the natural population. Therefore, this model assumes that the resources are unlimited and that the population grows (or decreases) at a constant rate. We know, however, that populations are limited by many mechanisms (eg interaction with populations of other species, resource constraints, dispersion limitation). One way in which populations are limited is related to their own density. These regulatory mechanisms associated with the density of the population are denominated dense dependence: changes in the vital rates of the populations associated to the variations of its own density.
Density dependence in a cacti population
In this exercise we will relax the premise of indefinite growth including a dense-dependence effect on one of the transition probabilities: transition in the cactus seedlings Escobaria robbinsorum (example in chapter 5 of Gurevitch et al 2009, a matrix of 3 stages of life).
Let us use the brake expression of the known logistic growth model, which will act on the probability of permanence of the seedlings (element a2,1 of the matrix). For this, this probability of transiting in time t+1 becomes the function
a2,1=amax(1−NtK)
Where amax is the maximum value of the transition probability from state 1 to 2, Nt the population size in time t, and K the population carrying capacity. The closer the population size is to K, the younger the seedling transition probability, the higher the mortality rate.
Inserting dense-dependency into spreadsheet
- 1. Open the DenDep spreadsheet of the file de dados do cactus Escobaria robbinsorum(Gurevitch et al 2009). of cactus data Escobaria robbinsorum (Gurevitch et al 2009). In cells
B4andB5we have the dense-dependency parameters:- amax=0,33
- $K = 50
- 2. Calculate the size of the population in time t: to do that, include in the cell
G15the formula=SUM(G12:G14).
- 3. In cell
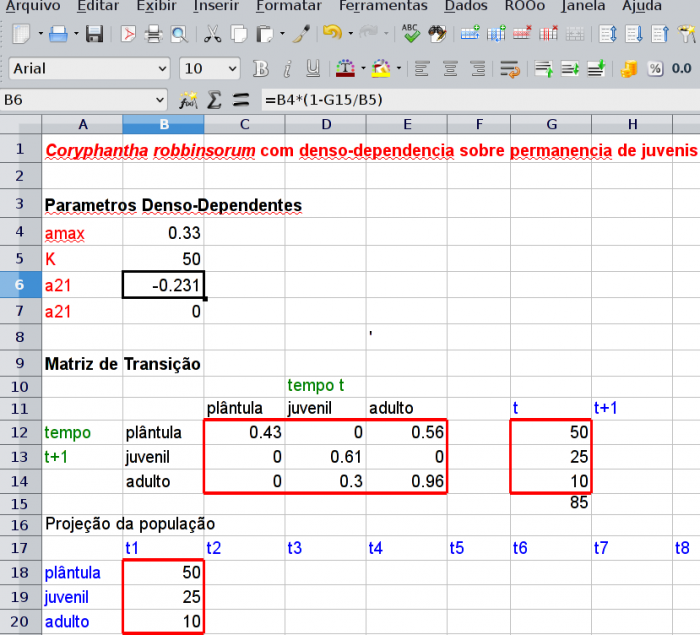
B6include the formula for calculating the density dependent transition probability:=B4*(1-G15/B5).
- 4. nclude in the cell
B7a condition using theIFfunction so that the probability of permanence does not fall below zero:=SE(B6<0;0;B6).
- 5. Direct the result of cell
B7to the transition matrix. For this, include in the cell “C13” the formula “=B7”.
Your spreadsheet should look like this one:
If you want to check, see the worksheet with the formulas here.
Projecting population sizes
Now you must perform, in H12:H14 cells, the multiplication of the transition matrix (cells $C$12:$E$14) by the time abundance vector t (cells G12:G14), following the same orientations of the script [en:ecovirt:roteiro:pop_str:pstr_mtexcel| basic model of transition matrices]]. This will result in the vector of abundances in time t+1. Now, just reiterate these calculations as follows:
- 1. Copy (using “copy special” wiht only “values”. Do not copy the formulas!!) the values of
H12:H14onG12:G14.
- 2. Copy the same values that were placed in the cells
G12:G14also for the column t2 (cellsC18:C20).
- 3. Note that by replacing the numbers in the
G12:G14cells, the formulas in theH12:H14cells will update their values and then you have projected the population one more step of time. Repeat steps 1 and 2 above and, with each substitution, go past the values obtained in the following columns (t3, t4, t5, t6, etc) of the cells “D18:D20”. Proceed until the lambda value (which is being automatically calculated on line 23) stabilizes.
- 4. Graph the number of individuals at each stage of life and in total as a function of time.
Exercício: Palmito sustentável
In our exerciseabout palmito extraction without dense dependence, we used a simple model to evaluate the sustainability of the extraction.
However, the results may be unrealistic. For example, in the original model: (1) there was no limitation to the growth of the palm heart population, (2) the transition rates do not vary from year to year; (3) management has no impact on transition rates.
The challenge here is to create a more realistic model, including density dependency. Use the transition matrix for a palmito population ( Euterpe edulis Mart.) In the Santa Genebra Reserve, Campinas (Frenckleton et al., 2002), which is in the worksheet palmitos2011.xls. Using the same procedure of the previous exercise with the cactus:
- Choose one of the transition rates to model the dense-dependence in the heart of palm population and justify the choice;
- Produce dense-dependency extraction scenarios for the palm heart population;
- Make projections and suggestions for the sustainable management of palm heart.
To learn more
Gotelli, N. J. 2007. Ecologia. Cap.2 - Crescimento Logistico de Populações. Pp. 26-48. Ed. Planta.
Gurevitch, J, Scheiner, S.M, Fox, G.A. 2009. Ecologia Vegetal. Cap. 5 - Ed. Artmed, São Paulo.
Silva Matos, D.M. et al. 1999. THE ROLE OF DENSITY DEPENDENCE IN THE POPULATION DYNAMICS OF A TROPICAL PALM. Ecology, 80(8), 1999, pp. 2635–2650
