−Table of Contents
Random walks: the drunk and the canyon - Tutorial for EcoVirtual
Imagine that a drunkard is walking in a huge plains, that has a canyon on one of the sides. Every time the drunkard steps forward, he also staggers to the left or to the right, with equal probability.
This is a very simple Markovian process, called random walk, on one dimension1). When the drunkard falls in the canyon, the random walk is over (and so is the drunkard), so we call this condition as absorbing boundary.
Virtual drunks
To proceed, you must have the R environment with the Rcmdr and Ecovirtual packages installed and loaded. If you do not have and do not know how to have them, see the Installation page.
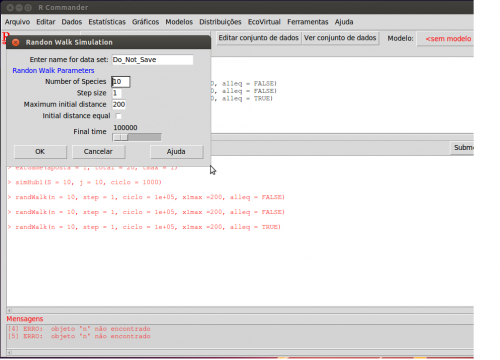
What can we predict about this process? Let's set some drunks lose on this virtual plains. To do this, we will use the menu EcoVirtual > Biogeographical Models > Random Walk to open the following options window:
Simulation parameters:
| Option | Parameter | |
|---|---|---|
Number of Species | S | Number of drunks |
Step Size | step | Number of steps the drunk moves sideway at each time interval |
Maximum Initial Distance | xlmax | maximum distance between the drunks and the canyon when the simulation starts |
Initial Distance Equal | alleq=TRUE | when selected (TRUE), all drunks start at the maximum distance. When unselected, the drunks start at random position from 1 to the maximum distance above |
Maximum time | tmax | total simulation time |
Example
Let's simulate ten drunkards, staggering for 10 steps at each time interval, for ten thousand time steps:
S =10
step = 10
xlmax = 200
alleq =  TRUE
tmax = 10000
As with every stochastic process, the results may vary at each simulation. Thus, repeat the simulation some times to make sure you understand the results.
Step effect
What happens if the drunks are more or less staggering? Try reducing the step size to 2:
S = 10
step = 2
xlmax = 200
alleq = TRUE
tmax = 10000
Time effect
Drunks that stagger less are less prone to end in the bottom of the canyon, or is it only a matter of time? Try increasing the final time:
S = 10
step = 2
xlmax = 200
alleq = TRUE
tmax = 50000
Question
The drunk has equal probability to stagger left or right, so on the average he only walks forward. Given enough time, this random walk with absorbing boundary has only one possible outcome. What is it?
Virtual population
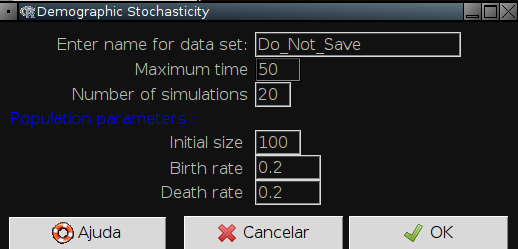
The options here control the simulation of populations under a continuous time random walk:
| Option | Parameter | Definition |
|---|---|---|
Enter name for last simulation data set | R object | R object in which to save the simulation results |
Maximum time | tmax | Maximum simulation time, in the same time unit as the rates used |
Number of simulations | nsim | Number of different populations to simulate |
Initial size | N0 | Initial population size |
birth rate | b | instantaneous birth rate (b) |
death rate | d | instantaneous death rate (d) |
Example
Simulate the trajectory of 20 population with equal birth and death rates, starting with 10 individuals each. Let the time continue up to 50 units:
tmax = 50
nsim = 20
N0 = 10
b = 0.2
d = 0.2
You should see a random walk graph, very similar to the drunks. The number of extinctions
up to the Maximum time is recorded in the upper left corner of the graph.
Questions
- Which are the corresponding parameters between the drunk random walk and the birth and death dynamics?
- The effects you have noted on the drunk simulation (step size and end time) affect the population dynamics in the same way?
- What is the consequence of this result for the conservation of natural populations?
To learn more
- We have simulated a dynamic with equal probability of births and deaths with an absorbing boundary. This is a particular case of stochastic birth and death processes. You can read more about them in the tutorial on demographic stochasticity.
- Chemotaxis - How a Small Organism Finds a Food Source: one excellent explanation about random walk and its application to another area in biology, as presented by MIT students.


